Esta referencia está disponible actualmente en inglés. La versión en español está en preparación.
Mesenchymal Stromal Cell Heterogeneity by Single-Cell RNA-seq
Por Benn Bluestein-Veyra, M.Sc. en Química Orgánica · Actualizado el 20 de octubre de 2026
ExaVeyra Sciences es un proveedor B2B con sede en Miami que suministra exosomas para uso estético tópico a clínicas con licencia, y remite a los prescriptores con licencia a una farmacia de preparados compuestos 503A que prepara formulaciones según prescripciones individuales.
| Pregunta | Respuesta |
|---|---|
| Qué cubre esta página | What single-cell transcriptomics reveals about subpopulations within stromal cell cultures, and how tissue source and culture conditions shift them. |
| Quién puede hacer pedidos | Clínicas y profesionales con licencia profesional activa y NPI verificados por ExaVeyra. Los pedidos de exosomas requieren además un reconocimiento firmado de uso profesional. |
| Qué se envía y cómo | El material de exosomas para uso estético tópico, caracterizado por lote, se envía en cadena de frío por exprés nocturno. La entrega puede tardar 1 a 3 días hábiles. Se emite un certificado de análisis para cada lote y se entrega a solicitud. |
MSC single-cell RNA-seq measures the transcriptome of each mesenchymal stromal cell in a culture, one cell at a time. Studies of cultured bone marrow, umbilical cord, adipose and dermal MSCs reported a shared core program with distinct subpopulations inside it.[1][2][3]
This reference follows the question from clonal assays to droplet sequencing, describes how tissue source, passage and culture conditions shift the subpopulations, and maps the stromal cells of bone marrow in vivo.[3][4][5]
Clonal assays first showed that MSC cultures are heterogeneous
Pittenger and colleagues isolated MSCs from the marrow of volunteer donors and induced them to differentiate into adipocytic, chondrocytic or osteocytic lineages. Individual cells expanded into colonies retained this multilineage potential.[6]
Muraglia and colleagues tested 185 human bone marrow stromal clones. All clones but one formed bone, about one third were tripotent, and 60% to 80% showed osteochondrogenic potential.[4]
Clones lost adipogenic and chondrogenic potential as cell doublings accumulated, which the authors read as a hierarchy in which tripotent progenitors give rise to osteochondrogenic and then osteogenic precursors.[4]
Donors and colonies vary in growth and lineage potential
Phinney and colleagues expanded marrow stromal cells from 17 healthy donors aged 19 to 45. First-passage growth rates varied up to 12-fold between donors, and alkaline phosphatase activity varied up to 40-fold.[7]
The authors concluded that each culture holds cells at various stages of differentiation, and that this mixture is propagated during expansion.[7] Russell and colleagues built a 96-well clonal assay and detected all eight possible categories of trilineage potential in normal bone marrow MSCs.[8]
In that assay, tripotent cells made up nearly half of the colony-forming cells and expanded more than unipotent clones, with about 2-fold higher CD146 fluorescence.[8] Time-lapse imaging by Rennerfeldt and colleagues showed that diversity also emerges within single colonies, and that media exchange coincided with diversification.[9][10]
Droplet and plate methods capture the transcriptome of each cell
A single-cell RNA-seq study begins with a suspension of single cells and a method that tags each transcript with the identity of its cell (Fig. 1).[11][12] Two capture designs dominate MSC work: droplet systems that count transcript ends in thousands of cells, and plate methods that sequence full-length transcripts from fewer cells.[12][13]
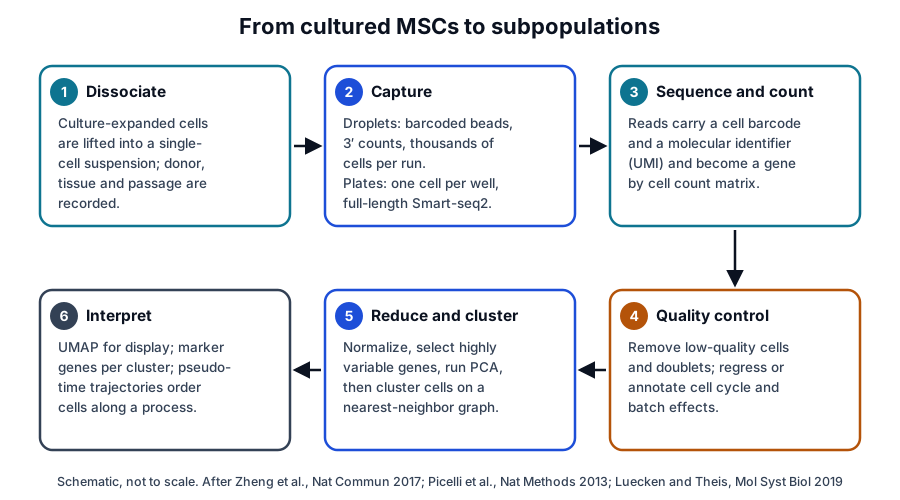
Zheng and colleagues described a droplet system that counts the 3′ ends of mRNAs in tens of thousands of cells per sample, with about 50% capture efficiency. They profiled about 250,000 cells across 29 samples and validated detection of rare populations with cell lines and synthetic RNAs.[12]
Picelli and colleagues introduced Smart-seq2, which uses template switching and preamplification to raise the yield and length of cDNA from single cells. Its libraries improved detection, coverage, bias and accuracy over the original Smart-seq method.[13]
The two designs trade cell number for depth. Droplet capture favors large surveys of subpopulations, and full-length plate methods favor coverage and detection within each cell.[12][13]
Clustering, UMAP and trajectory analysis turn counts into subpopulations
Luecken and Theis set out the standard analysis: quality control, normalization, data correction, feature selection and dimensionality reduction, followed by cell-level and gene-level analysis. Their best-practice recommendations rest on independent comparison studies.[11]
Clusters of cells with similar expression are then displayed in two dimensions. Becht and colleagues compared UMAP with five other tools on mass cytometry and single-cell RNA-seq data and found the fastest run times, highest reproducibility and most meaningful organization of clusters.[14]
Trajectory methods order cells along a continuous process. Trapnell and colleagues introduced Monocle, which places cells in pseudotime and revealed switch-like changes in regulatory factors during differentiation of primary human myoblasts.[15]
- Quality control removes low-quality cells and doublets before analysis.[11]
- Cell cycle and batch effects dominated the variation in one Wharton’s jelly MSC dataset and were regressed out before clustering.[2]
- Highly variable genes drive principal component analysis, graph-based clustering and the UMAP display.[2][14]
- Pseudotime orders cells by transcriptional progress and supports inference of transcription factors along a path.[15][16]
MSC single-cell RNA-seq of cultured cells reveals a structured population
Freeman and colleagues applied single-cell RNA-seq to mouse bone marrow MSCs. Genes associated with multipotency were expressed at high, consistent levels, while osteogenic, chondrogenic, adipogenic, neurogenic and smooth muscle genes varied widely between cells.[17]
Certain immunomodulatory genes also varied from cell to cell, independently of proliferation cycles. The authors read the pattern as lineage priming, in which individual cells already express genes of different lineages.[17]
Cell cycle state accounts for much of the variation in cord MSCs
Huang and colleagues profiled 361 umbilical cord MSCs from two cords at different passages, with and without IFN-gamma and TNF-alpha. Network analysis found limited heterogeneity across donors and passages, and cytokine exposure produced uniform changes.[1]
The variation that remained tracked entry into G2/M phase. One featured gene, CD168, was expressed in a cell cycle-dependent way, and sorted CD168-high cells regenerated the same expression pattern in culture.[1]
Wharton’s jelly MSCs separate into proliferative, matrix and chemokine subsets
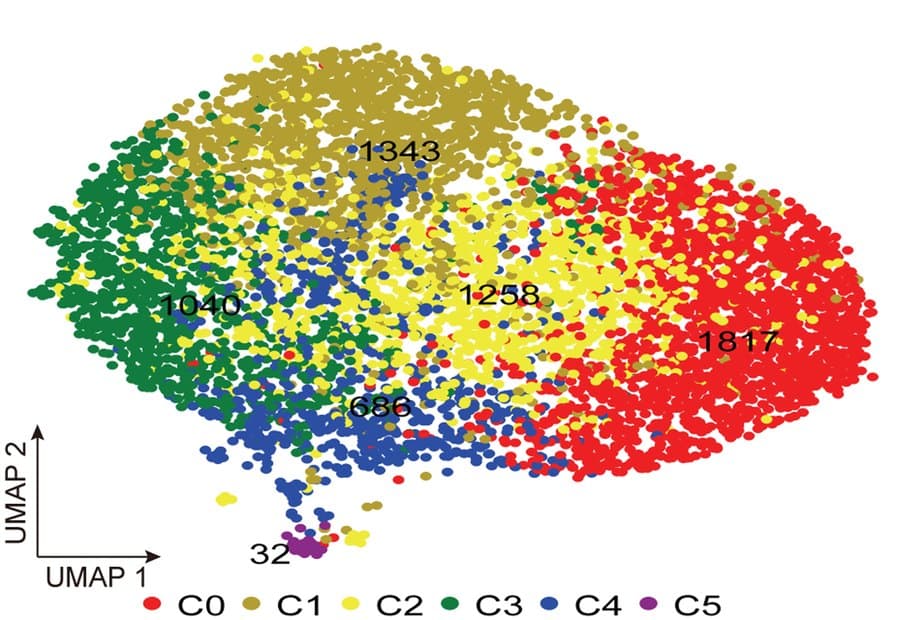
Sun and colleagues sequenced Wharton’s jelly MSCs from three donors and found that cell cycle and batch were the dominant sources of variation. After regressing both out, graph-based clustering identified six candidate subpopulations (Fig. 2).[2]
MKI67 was higher in two clusters, collagen genes in another and chemokine genes in a fourth, while classic MSC markers were expressed at similar levels across clusters. Sorted CD142+ and CD142- cells differed in proliferation and in a scratch migration assay.[2]
The highly variable genes mapped to chemokine and cytokine signaling, integrin signaling and angiogenesis. Wharton’s jelly and adipose MSCs shared most of these genes despite their different tissue origins.[2]
Tissue source, passage and culture history shift the subpopulations
Wang and colleagues built an atlas of more than 130,000 single-MSC transcriptomes from bone marrow, adipose tissue, umbilical cord and dermis. They identified five conserved subpopulations shared across tissues and seven tissue-specific ones (Fig. 3).[3]
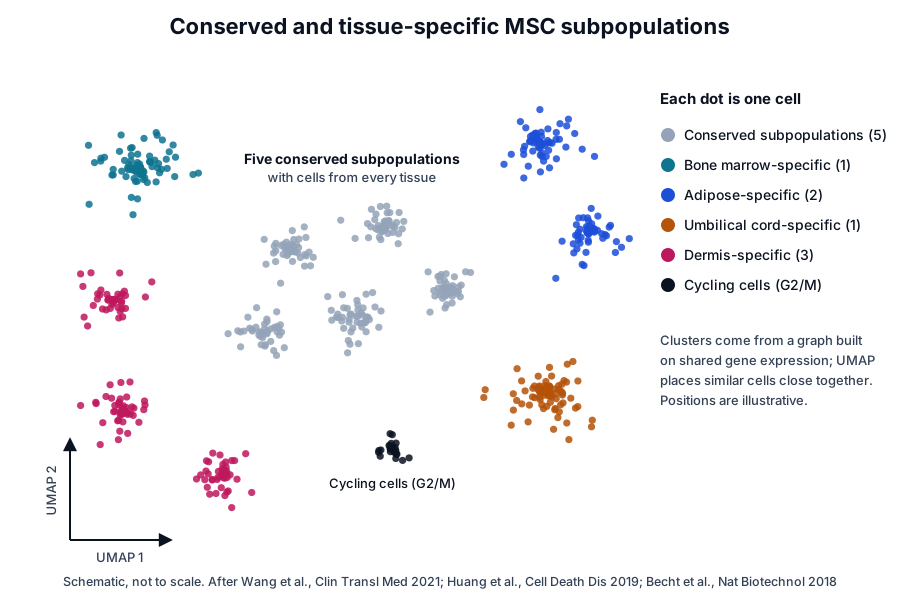
Extracellular matrix genes contributed most to heterogeneity in the atlas, and tissue-specific subpopulations differed in matrix-associated immune regulation, antigen processing and presentation, and senescence. An umbilical cord-specific subpopulation differed in immunosuppression-related gene expression.[3]
Uncultured cord cells and their cultured descendants differ
Zhang and colleagues sequenced freshly isolated, uncultured umbilical cord MSCs and found two populations separated by genes including CD73. One group was enriched for immune regulatory and stemness genes, the other for extracellular matrix production and osteoblast and chondrocyte differentiation.[18]
Wang and colleagues compared cord tissue with its cognate culture-expanded MSCs. They identified three subgroups in culture, inferred transcription factors for state transitions by trajectory analysis, and linked telomere-related pathways to expansion in vitro.[16]
Serial passage adds pre-senescent and senescent states
Taherian Fard and colleagues followed serially passaged MSCs derived from human embryonic stem cells. Cells passed through pre-senescent states before entering three distinct senescent states, and gene regulatory networks lost connectivity along the way.[19]
Donor, harvest and medium handling shape the starting mixture as well. Differences between donors persisted across repeat aspirates, and media exchange coincided with diversification within colonies.[7][9]
Bone marrow stroma in vivo centers on CXCL12-abundant reticular and LEPR+ cells
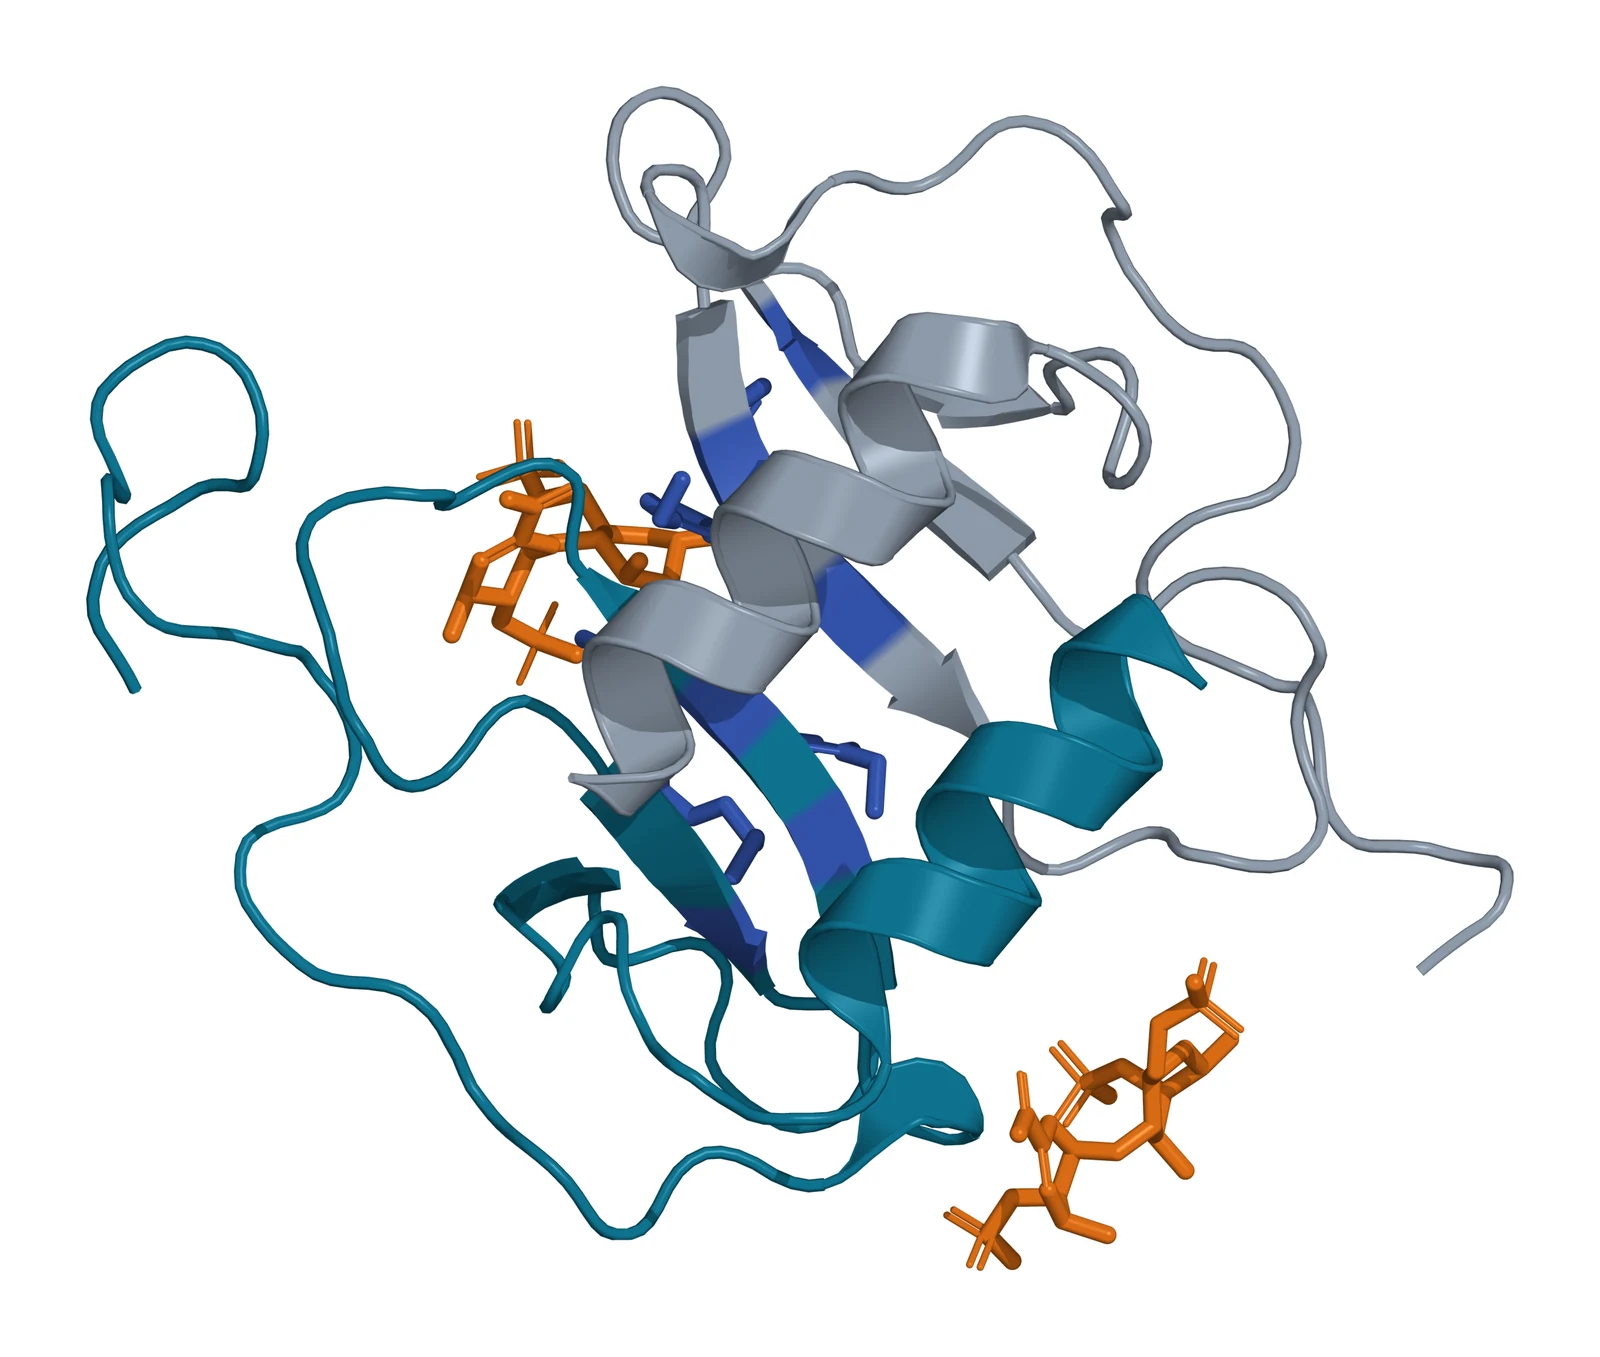
CXCL12 is a small chemokine encoded on human chromosome 10q11.21.[20] Murphy and colleagues solved CXCL12 with heparin disaccharides, finding one bound in the dimer interface by His25, Lys27 and Arg41 (Fig. 4).[21]
Sugiyama and colleagues found most hematopoietic stem cells in contact with stromal cells expressing high CXCL12, which they named CXCL12-abundant reticular (CAR) cells. CAR cells surrounded sinusoidal endothelium or sat near the endosteum.[22]
Omatsu and colleagues showed that CAR cells are adipo-osteogenic progenitors. Their short-term ablation in mice reduced the adipogenic and osteogenic potential of marrow cells and their production of SCF and CXCL12.[23]
The authors proposed that glycosaminoglycans bind around CXCL12 dimers as they hold and present the chemokine to its receptor CXCR4.[21]
LEPR marks the colony-forming stromal cells of adult marrow
Zhou and colleagues found that leptin receptor (LEPR) highly enriches mouse bone marrow MSCs. About 0.3% of marrow cells were LEPR+, and these cells accounted for 94% of the colony-forming fibroblast units.[24] Human LEPR is encoded on chromosome 1p31.3.[25]
LEPR+ cells formed bone, cartilage and adipocytes in culture and in vivo, and expressed high Cxcl12 and Scf reporters. Fate mapping showed that they arise after birth and give rise to most bone and adipocytes formed in adult marrow.[24]
Single-cell and spatial maps resolve the marrow niche
Tikhonova and colleagues mapped mouse marrow vascular, perivascular and osteoblast populations at single-cell resolution. They found previously unappreciated heterogeneity and resolved which cells produce hematopoietic growth factors, chemokines and membrane-bound ligands.[26]
The same study profiled the niche during stress-induced hematopoiesis and found considerable transcriptional remodeling, including an adipocytic skew of perivascular cells.[26]
Baccin and colleagues combined single-cell and spatial transcriptomics and split CAR cells into Adipo-CAR and Osteo-CAR subsets. These localized to sinusoidal and arteriolar surfaces and acted as cytokine-secreting cells that form perivascular micro-niches.[5]
Their RNA-Magnet algorithm inferred the three-dimensional organization of the marrow from single-cell transcriptome data, which the authors offer as a systematic approach to whole organs.[5]
Wolock and colleagues sequenced non-hematopoietic marrow cells and combined a computed cell state hierarchy with transcription factor expression. They mapped differentiation paths to the osteocyte, chondrocyte and adipocyte lineages and validated them with reporter strains.[27]
Single-cell data add resolution to MSC characterization
The ISCT minimal criteria define MSCs by plastic adherence, expression of CD105, CD73 and CD90 without hematopoietic markers or HLA-DR, and trilineage differentiation in vitro.[28] Single-cell data show that cells meeting these criteria share the classic markers across subpopulations.[2]
The subpopulations differ in cell cycle state, matrix genes, chemokine genes and lineage priming.[1][2][17] Recording donor, tissue, passage and culture conditions alongside the sequencing data lets laboratories compare these features across studies.[3][11]
Single-cell data also connect culture biology to tissue biology. Immune regulatory and matrix-forming groups appear in uncultured cord cells and in the multi-tissue culture atlas, placing cultured subpopulations in a tissue context.[3][18]
| Study | Cells profiled | Main finding |
|---|---|---|
| Freeman 2015 | Mouse bone marrow MSCs in culture | Multipotency genes uniform; lineage genes vary between cells |
| Huang 2019 | 361 umbilical cord MSCs, two donors | Limited heterogeneity, largely set by G2/M entry |
| Sun 2020 | Wharton’s jelly MSCs, three donors | Six candidate subpopulations after cell cycle correction |
| Zhang 2021 | Uncultured umbilical cord MSCs | Two populations: immune regulatory and matrix-forming |
| Wang Q 2021 | Cord tissue and cultured cord MSCs | Three subgroups in culture with inferred state transitions |
| Wang Z 2021 | Over 130,000 MSCs from four tissues | Five conserved and seven tissue-specific subpopulations |
| Taherian Fard 2024 | Serially passaged ESC-derived MSCs | Pre-senescent states and three senescent states |
Surface markers found this way can be tested directly. Sorting on CD168 or CD142 linked a transcriptional cluster to a measurable property in culture.[1][2]
Where to go from here
The ISCT minimal criteria reference covers the marker panel that defines the cells sequenced in these studies, and the source tissues reference compares bone marrow, adipose tissue, umbilical cord and placenta. The licensing and preconditioning reference follows the cytokine exposures that shift MSC gene expression in culture.
The secretome reference describes what MSC cultures release into their medium, and the perinatal tissue donor eligibility reference explains the federal framework for cord and placental material. Verified practices can request lot documentation, and our team is glad to discuss the methods described on this page.
Referencias comentadas
Numeradas en el orden en que se citan en el texto. Cada fuente lleva una nota sobre lo que respalda en esta página; los artículos revisados por pares se listan con revista, volumen, número y páginas, y las fuentes primarias son regulaciones, documentos de agencias y bases de datos de referencia.
- 1.Peer-reviewedHuang Y, Li Q, Zhang K, et al. Single cell transcriptomic analysis of human mesenchymal stem cells reveals limited heterogeneity. Cell Death & Disease. 2019;10(5):368. https://pubmed.ncbi.nlm.nih.gov/31068579/Annotation: Single-cell transcriptomes of 361 umbilical cord MSCs across passages and cytokine exposure. Cited for limited heterogeneity dominated by G2/M entry and cell cycle-dependent CD168.
- 2.Peer-reviewedSun C, Wang L, Wang H, et al. Single-cell RNA-seq highlights heterogeneity in human primary Wharton’s jelly mesenchymal stem/stromal cells cultured in vitro. Stem Cell Research & Therapy. 2020;11(1):149. https://pubmed.ncbi.nlm.nih.gov/32252818/Annotation: Single-cell RNA-seq of Wharton’s jelly MSCs from three donors. Cited for six candidate clusters, MKI67, collagen and chemokine differences, shared classic markers and CD142 sorting.
- 3.Peer-reviewedWang Z, Chai C, Wang R, et al. Single-cell transcriptome atlas of human mesenchymal stem cells exploring cellular heterogeneity. Clinical and Translational Medicine. 2021;11(12):e650. https://pubmed.ncbi.nlm.nih.gov/34965030/Annotation: Atlas of more than 130,000 MSC transcriptomes from four tissues. Cited for five conserved and seven tissue-specific subpopulations and the contribution of extracellular matrix genes.
- 4.Peer-reviewedMuraglia A, Cancedda R, Quarto R. Clonal mesenchymal progenitors from human bone marrow differentiate in vitro according to a hierarchical model. Journal of Cell Science. 2000;113 ( Pt 7):1161-1166. https://pubmed.ncbi.nlm.nih.gov/10704367/Annotation: Clonal analysis of 185 human bone marrow stromal clones. Cited for the proportions of osteogenic, tripotent and osteochondrogenic clones and the loss of potential with cell doublings.
- 5.Peer-reviewedBaccin C, Al-Sabah J, Velten L, et al. Combined single-cell and spatial transcriptomics reveal the molecular, cellular and spatial bone marrow niche organization. Nature Cell Biology. 2020;22(1):38-48. https://pubmed.ncbi.nlm.nih.gov/31871321/Annotation: Single-cell and spatial transcriptomics of mouse marrow. Cited for Adipo-CAR and Osteo-CAR subsets at sinusoidal and arteriolar surfaces forming perivascular micro-niches.
- 6.Peer-reviewedPittenger MF, Mackay AM, Beck SC, et al. Multilineage potential of adult human mesenchymal stem cells. Science. 1999;284(5411):143-147. https://pubmed.ncbi.nlm.nih.gov/10102814/Annotation: Isolation and differentiation study of human marrow MSCs. Cited for adipocytic, chondrocytic and osteocytic differentiation and for single cells whose colonies kept multilineage potential.
- 7.Peer-reviewedPhinney DG, Kopen G, Righter W, et al. Donor variation in the growth properties and osteogenic potential of human marrow stromal cells. Journal of Cellular Biochemistry. 1999;75(3):424-436. https://pubmed.ncbi.nlm.nih.gov/10536366/Annotation: Comparison of marrow stromal cells from 17 healthy donors. Cited for up to 12-fold growth and 40-fold alkaline phosphatase variation and for heterogeneity propagated during expansion.
- 8.Peer-reviewedRussell KC, Phinney DG, Lacey MR, et al. In vitro high-capacity assay to quantify the clonal heterogeneity in trilineage potential of mesenchymal stem cells reveals a complex hierarchy of lineage commitment. Stem Cells. 2010;28(4):788-798. https://pubmed.ncbi.nlm.nih.gov/20127798/Annotation: 96-well clonal assay of bone marrow MSCs. Cited for all eight trilineage categories, tripotent cells as nearly half of colony-forming cells, and higher CD146 on tripotent clones.
- 9.Peer-reviewedRennerfeldt DA, Raminhos JS, Leff SM, et al. Emergent heterogeneity in putative mesenchymal stem cell colonies: Single-cell time lapsed analysis. PLoS One. 2019;14(4):e0213452. https://pubmed.ncbi.nlm.nih.gov/30943212/Annotation: Time-lapse imaging of bone marrow stromal cell colony formation. Cited for heterogeneity emerging within colonies and for diversification concurrent with media exchange.
- 10.Peer-reviewedRennerfeldt DA, Van Vliet KJ. Concise Review: When Colonies Are Not Clones: Evidence and Implications of Intracolony Heterogeneity in Mesenchymal Stem Cells. Stem Cells. 2016;34(5):1135-1141. https://pubmed.ncbi.nlm.nih.gov/26840390/Annotation: Review of intracolony MSC heterogeneity. Cited for variation among donors, within populations from one donor and within single-cell-derived colonies.
- 11.Peer-reviewedLuecken MD, Theis FJ. Current best practices in single-cell RNA-seq analysis: a tutorial. Molecular Systems Biology. 2019;15(6):e8746. https://pubmed.ncbi.nlm.nih.gov/31217225/Annotation: Tutorial review of single-cell RNA-seq analysis. Cited for the workflow of quality control, normalization, correction, feature selection, dimensionality reduction and downstream analysis.
- 12.Peer-reviewedZheng GX, Terry JM, Belgrader P, et al. Massively parallel digital transcriptional profiling of single cells. Nature Communications. 2017;8:14049. https://pubmed.ncbi.nlm.nih.gov/28091601/Annotation: Description of a droplet-based single-cell system. Cited for 3 prime mRNA counting in tens of thousands of cells per sample, about 50% capture efficiency and rare-population detection.
- 13.Peer-reviewedPicelli S, Björklund ÅK, Faridani OR, et al. Smart-seq2 for sensitive full-length transcriptome profiling in single cells. Nature Methods. 2013;10(11):1096-1098. https://pubmed.ncbi.nlm.nih.gov/24056875/Annotation: Methods paper introducing Smart-seq2. Cited for full-length single-cell libraries with template switching and preamplification and improved detection, coverage, bias and accuracy.
- 14.Peer-reviewedBecht E, McInnes L, Healy J, et al. Dimensionality reduction for visualizing single-cell data using UMAP. Nature Biotechnology. 2018;37:38-44. https://pubmed.ncbi.nlm.nih.gov/30531897/Annotation: Benchmark of UMAP against five dimensionality-reduction tools. Cited for run time, reproducibility and organization of clusters in single-cell data.
- 15.Peer-reviewedTrapnell C, Cacchiarelli D, Grimsby J, et al. The dynamics and regulators of cell fate decisions are revealed by pseudotemporal ordering of single cells. Nature Biotechnology. 2014;32(4):381-386. https://pubmed.ncbi.nlm.nih.gov/24658644/Annotation: Methods paper introducing Monocle. Cited for pseudotemporal ordering of single cells and switch-like regulatory changes during myoblast differentiation.
- 16.Peer-reviewedWang Q, Li J, Wang S, et al. Single-cell transcriptome profiling reveals molecular heterogeneity in human umbilical cord tissue and culture-expanded mesenchymal stem cells. The FEBS Journal. 2021;288(18):5311-5330. https://pubmed.ncbi.nlm.nih.gov/33763993/Annotation: Single-cell comparison of umbilical cord tissue and cognate cultured MSCs. Cited for three cultured subgroups, trajectory-inferred transcription factors and telomere-related pathways.
- 17.Peer-reviewedFreeman BT, Jung JP, Ogle BM. Single-Cell RNA-Seq of Bone Marrow-Derived Mesenchymal Stem Cells Reveals Unique Profiles of Lineage Priming. PLoS One. 2015;10(9):e0136199. https://pubmed.ncbi.nlm.nih.gov/26352588/Annotation: Single-cell RNA-seq of cultured mouse bone marrow MSCs. Cited for uniform multipotency genes, variable lineage and immunomodulatory genes, and lineage priming.
- 18.Peer-reviewedZhang S, Wang JY, Li B, et al. Single-cell transcriptome analysis of uncultured human umbilical cord mesenchymal stem cells. Stem Cell Research & Therapy. 2021;12(1):25. https://pubmed.ncbi.nlm.nih.gov/33413643/Annotation: Single-cell RNA-seq of freshly isolated cord MSCs. Cited for two populations separated by genes including CD73, one immune regulatory and one matrix and osteochondrogenic.
- 19.Peer-reviewedTaherian Fard A, Leeson HC, Aguado J, et al. Deconstructing heterogeneity of replicative senescence in human mesenchymal stem cells at single cell resolution. GeroScience. 2024;46(1):999-1015. https://pubmed.ncbi.nlm.nih.gov/37314668/Annotation: Single-cell RNA-seq of serially passaged ESC-derived MSCs. Cited for pre-senescent states, three senescent states and loss of gene regulatory network connectivity.
- 20.DatabaseNCBI Gene 6387, CXCL12 C-X-C motif chemokine ligand 12 (Homo sapiens). Accessed 20 October 2026. https://www.ncbi.nlm.nih.gov/gene/6387
- 21.Peer-reviewedMurphy JW, Cho Y, Sachpatzidis A, et al. Structural and functional basis of CXCL12 (stromal cell-derived factor-1 alpha) binding to heparin. Journal of Biological Chemistry. 2007;282(13):10018-10027. https://pubmed.ncbi.nlm.nih.gov/17264079/Annotation: NMR and crystal structure of CXCL12 with heparin disaccharides (PDB 2NWG). Cited for the dimer-interface binding site at His25, Lys27 and Arg41 and the proposed glycosaminoglycan presentation model.
- 22.Peer-reviewedSugiyama T, Kohara H, Noda M, et al. Maintenance of the hematopoietic stem cell pool by CXCL12-CXCR4 chemokine signaling in bone marrow stromal cell niches. Immunity. 2006;25(6):977-988. https://pubmed.ncbi.nlm.nih.gov/17174120/Annotation: Mouse bone marrow niche study. Cited for naming CXCL12-abundant reticular cells, their contact with hematopoietic stem cells and their sinusoidal and endosteal positions.
- 23.Peer-reviewedOmatsu Y, Sugiyama T, Kohara H, et al. The essential functions of adipo-osteogenic progenitors as the hematopoietic stem and progenitor cell niche. Immunity. 2010;33(3):387-399. https://pubmed.ncbi.nlm.nih.gov/20850355/Annotation: Mouse CAR cell ablation study. Cited for CAR cells as adipo-osteogenic progenitors and their role in marrow SCF and CXCL12 production.
- 24.Peer-reviewedZhou BO, Yue R, Murphy MM, et al. Leptin-receptor-expressing mesenchymal stromal cells represent the main source of bone formed by adult bone marrow. Cell Stem Cell. 2014;15(2):154-168. https://pubmed.ncbi.nlm.nih.gov/24953181/Annotation: Mouse marker and fate-mapping study. Cited for LEPR+ cells as 0.3% of marrow cells holding 94% of CFU-F, their trilineage potential, Cxcl12 and Scf reporters and postnatal origin.
- 25.DatabaseNCBI Gene 3953, LEPR leptin receptor (Homo sapiens). Accessed 20 October 2026. https://www.ncbi.nlm.nih.gov/gene/3953
- 26.Peer-reviewedTikhonova AN, Dolgalev I, Hu H, et al. The bone marrow microenvironment at single-cell resolution. Nature. 2019;569(7755):222-228. https://pubmed.ncbi.nlm.nih.gov/30971824/Annotation: Single-cell transcriptomic map of mouse marrow vascular, perivascular and osteoblast cells. Cited for niche heterogeneity and the cellular sources of growth factors, chemokines and ligands.
- 27.Peer-reviewedWolock SL, Krishnan I, Tenen DE, et al. Mapping Distinct Bone Marrow Niche Populations and Their Differentiation Paths. Cell Reports. 2019;28(2):302-311.e5. https://pubmed.ncbi.nlm.nih.gov/31291568/Annotation: Single-cell RNA-seq of non-hematopoietic mouse marrow cells. Cited for stromal subpopulations and differentiation paths to osteocyte, chondrocyte and adipocyte lineages.
- 28.Peer-reviewedDominici M, Le Blanc K, Mueller I, et al. Minimal criteria for defining multipotent mesenchymal stromal cells. The International Society for Cellular Therapy position statement. Cytotherapy. 2006;8(4):315-317. https://pubmed.ncbi.nlm.nih.gov/16923606/Annotation: ISCT position statement. Cited for plastic adherence, the CD105, CD73 and CD90 positive and hematopoietic and HLA-DR negative marker panel, and trilineage differentiation.
Cite this page
ExaVeyra Sciences Editorial Team. Mesenchymal Stromal Cell Heterogeneity by Single-Cell RNA-seq. ExaVeyra Sciences; 20 October 2026. Available from: https://exaveyra.com/science/stem-cells/msc-single-cell-heterogeneity. Accessed [date accessed].
Fuentes de las figuras
- 29.PDB 2NWG, Human CXCL12 in complex with heparin disaccharides. ExaVeyra Sciences, rendered in PyMOL from PDB 2NWG. Structure data: RCSB Protein Data Bank (rcsb.org), CC0. Publicación de la estructura: Murphy JW, Cho Y, Sachpatzidis A, Fan C, Hodsdon ME, Lolis E. Structural and functional basis of CXCL12 (stromal cell-derived factor-1 alpha) binding to heparin. J Biol Chem. 2007;282(13):10018-10027.