Extracellular Vesicle Purity: Particle-to-Protein Ratios
By Benn Bluestein-Veyra, M.Sc. Organic Chemistry · Updated 20 October 2026
ExaVeyra Sciences is a Miami-based B2B supplier of exosomes for topical aesthetic use to licensed clinics, and it refers licensed prescribers to a 503A compounding pharmacy that prepares formulations against individual prescriptions.
| Question | Answer |
|---|---|
| What this page covers | How EV preparations are scored for purity: particle-to-protein and particle-to-lipid ratios, lipoprotein and protein co-isolates, and what each ratio reflects. |
| Who can order | Licensed clinics and practitioners whose active professional license and NPI ExaVeyra has verified. Exosome orders also require a signed professional-use acknowledgment. |
| What ships, and how | Exosome material for topical aesthetic use, characterized by lot, ships overnight in a cold chain. Delivery can take 1 to 3 business days. A certificate of analysis is issued for every lot and provided on request. |
Extracellular vesicle purity describes how much of a preparation consists of vesicles and how much consists of co-isolated free protein, protein aggregates and lipoproteins. The field most often scores it with ratios between bulk measurements, led by the particle-to-protein ratio Webber and Clayton proposed in 2013.[1][2]
This page covers how those ratios are built, what raises and lowers them, which co-isolates dominate blood and culture media, how isolation methods change the result, and what MISEV2023 asks laboratories to report.[3]
Extracellular vesicle purity is expressed as a ratio of bulk measurements
A vesicle preparation is a mixture of lipid-bilayer vesicles and non-vesicular extracellular particles that share their size, density or composition. MISEV2023 notes that these particles can greatly outnumber vesicles in biological matrices, so most separation methods recover both.[3]
MISEV2018 proposed that ratios between quantification methods give useful measures of purity. It named the protein to particle, protein to lipid and RNA to particle ratios as candidate metrics, and noted that their transfer across different assays was still being established.[2]
The same guidelines grouped separation methods by recovery and specificity. Polymer precipitation and lengthy ultracentrifugation recover most extracellular material, while density gradients and affinity capture recover fewer components with higher specificity.[2]
The particle-to-protein ratio scores purity with two routine assays
Webber and Clayton divided the particle count from nanoparticle tracking analysis by the protein concentration from a micro BCA assay, giving particles per microgram of protein (Fig. 1). They proposed it as a routine quality check that any laboratory could apply to every preparation.[1]
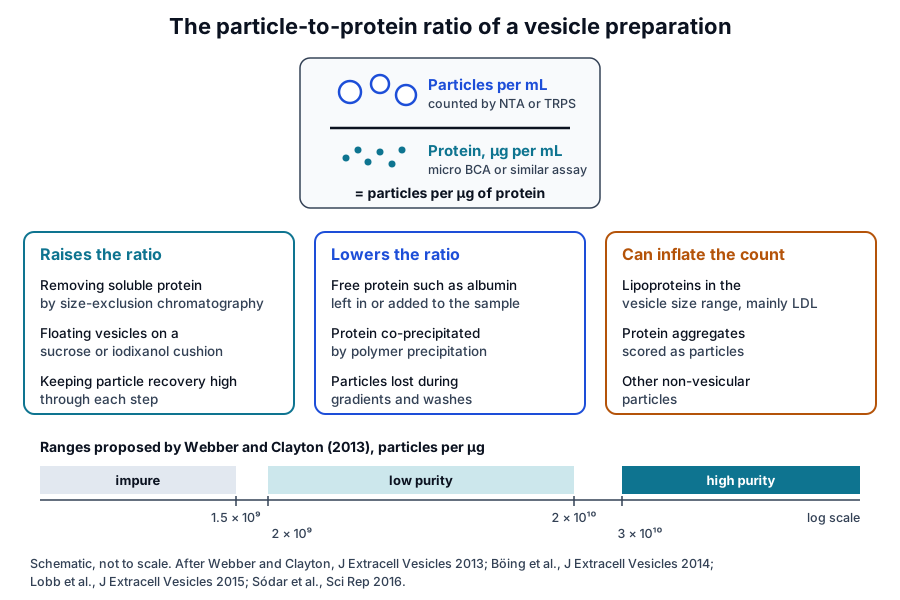
They tested the ratio by adding particle-free bovine serum albumin to a purified preparation. Protein rose while particle counts held steady, and a halving of the ratio corresponded to roughly 40 to 50 percent more non-vesicular protein in their assay.[1]
From their culture and biofluid samples the authors proposed three ranges. Ratios above 3 × 10¹⁰ particles per microgram indicated high purity, 2 × 10⁹ to 2 × 10¹⁰ low purity, and ratios below 1.5 × 10⁹ an impure preparation.[1]
- Unpurified medium from standard culture flasks gave about 1 × 10⁷ particles per microgram; pelleting raised it about 60-fold and a wash a further 4.6-fold.[1]
- Flotation on a sucrose cushion gave the highest values in the study, approaching 3.4 × 10¹⁰ particles per microgram.[1]
- Pellet-and-wash preparations from fresh serum and urine reached about 9.7 × 10⁸, around 34-fold below the sucrose cushion value.[1]
- Medium with vesicle-depleted fetal bovine serum alone gave about 1 × 10⁶, which the authors set as the background of non-cell-derived particles.[1]
The ratio also reflects how many particles the source contains. Serum gave higher ratios than urine despite its far higher protein content, because unpurified urine held about 800-fold fewer particles than serum.[1]
The authors stated two assumptions behind the method. It treats every counted particle as a vesicle, and it assumes each vesicle carries a comparable amount of protein.[1]
Lipid measurements add a membrane-specific denominator
Every vesicle has a lipid bilayer, so total lipid offers a measure tied to membranes. Osteikoetxea and colleagues adapted the sulfo-phospho-vanillin assay to a 96-well format and reported protein to lipid ratios for apoptotic bodies, microvesicles and exosomes from several cell lines and plasma.[4]
Each subpopulation had a characteristic ratio, with protein to lipid rising as vesicle diameter increased. A high-speed pellet with an abnormally high ratio contained no vesicular structures by electron microscopy, and washing red cell microvesicles brought an elevated ratio back to the expected value by the third wash.[4]
Visnovitz and colleagues later replaced organic-solvent lipid standards with an aqueous liposome standard, which raised sensitivity about tenfold. They reported that lipid-based measurements of vesicles can be more reliable than protein-based ones.[5]
The same group related lipid to particle measurements. They calculated total membrane surface per milliliter from resistive pulse sensing diameters and counts, set it against measured lipid, and proposed pairing the lipid assay with protein or particle measurements.[5]
Mihály and colleagues derived a spectroscopic protein to lipid ratio from the amide and CH stretching bands of infrared spectra. The ratio distinguished vesicle subpopulations and also carried information on aggregated proteins, lipoproteins and immune complexes in the sample.[6]
Ghosal and colleagues applied the same reasoning to non-vesicular extracellular particles. These particles had significantly higher protein to lipid ratios than vesicle subtypes and were enriched in cholesteryl esters and triacylglycerols.[7]
Lipoproteins are the principal particulate co-isolates of blood
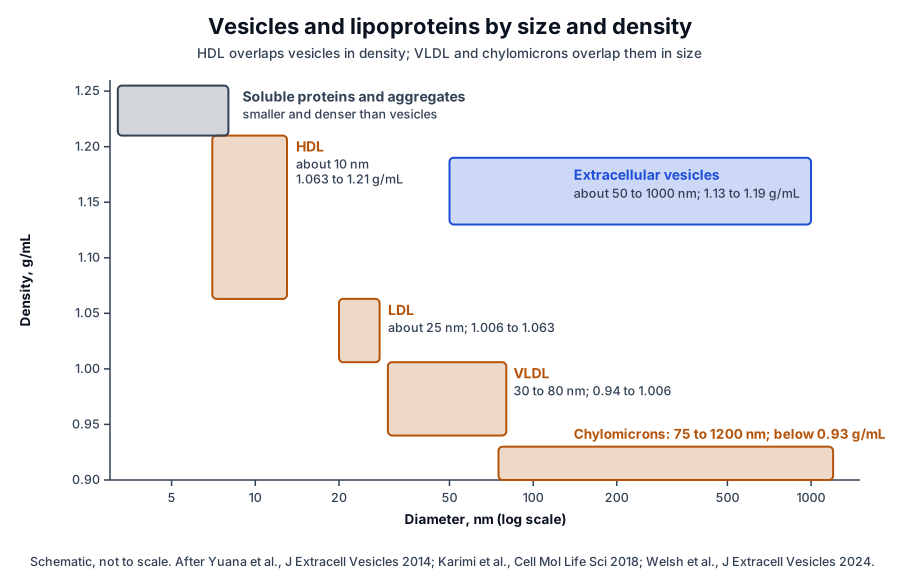
Lipoproteins overlap with blood vesicles in size, density or both (Fig. 2). MISEV2023 notes that every class except HDL overlaps vesicles in size, HDL overlaps them in density, and some lipoprotein subtypes outnumber blood vesicles by orders of magnitude.[3][8]
Sódar and colleagues found by flow cytometry that most particles in the vesicle size range in platelet-free plasma lacked common vesicle markers. They identified most of them as lipoproteins, predominantly LDL, which co-purified with vesicles and associated with them on mixing in vitro.[9]
Yuana and colleagues showed the density side of the overlap. HDL isolated between 1.063 and 1.21 g/mL shares the 1.13 to 1.19 g/mL density of plasma vesicles, and electron microscopy of that fraction found about one vesicle for every hundred HDL particles.[10]
Karimi and colleagues summarized the size side. Chylomicrons range from 75 to 1200 nm and VLDL from 30 to 80 nm, both overlapping vesicles, while IDL, LDL and HDL fall within 5 to 35 nm.[11]
The structural proteins of these particles serve as MISEV category 3 purity markers.[3] Apolipoprotein A-I is the major protein of HDL (Fig. 3a),[12] and apolipoprotein B100 wraps the LDL particle as a continuous beta-sheet belt beside a globular N-terminal domain (Fig. 3b).[13][14]
Lipoproteins enter the ratios in two ways. Particles in the counting range add to the numerator, as Sódar and colleagues showed for LDL, and MISEV2023 notes that total lipid measurements may overestimate vesicles when lipoproteins are present.[3][9]
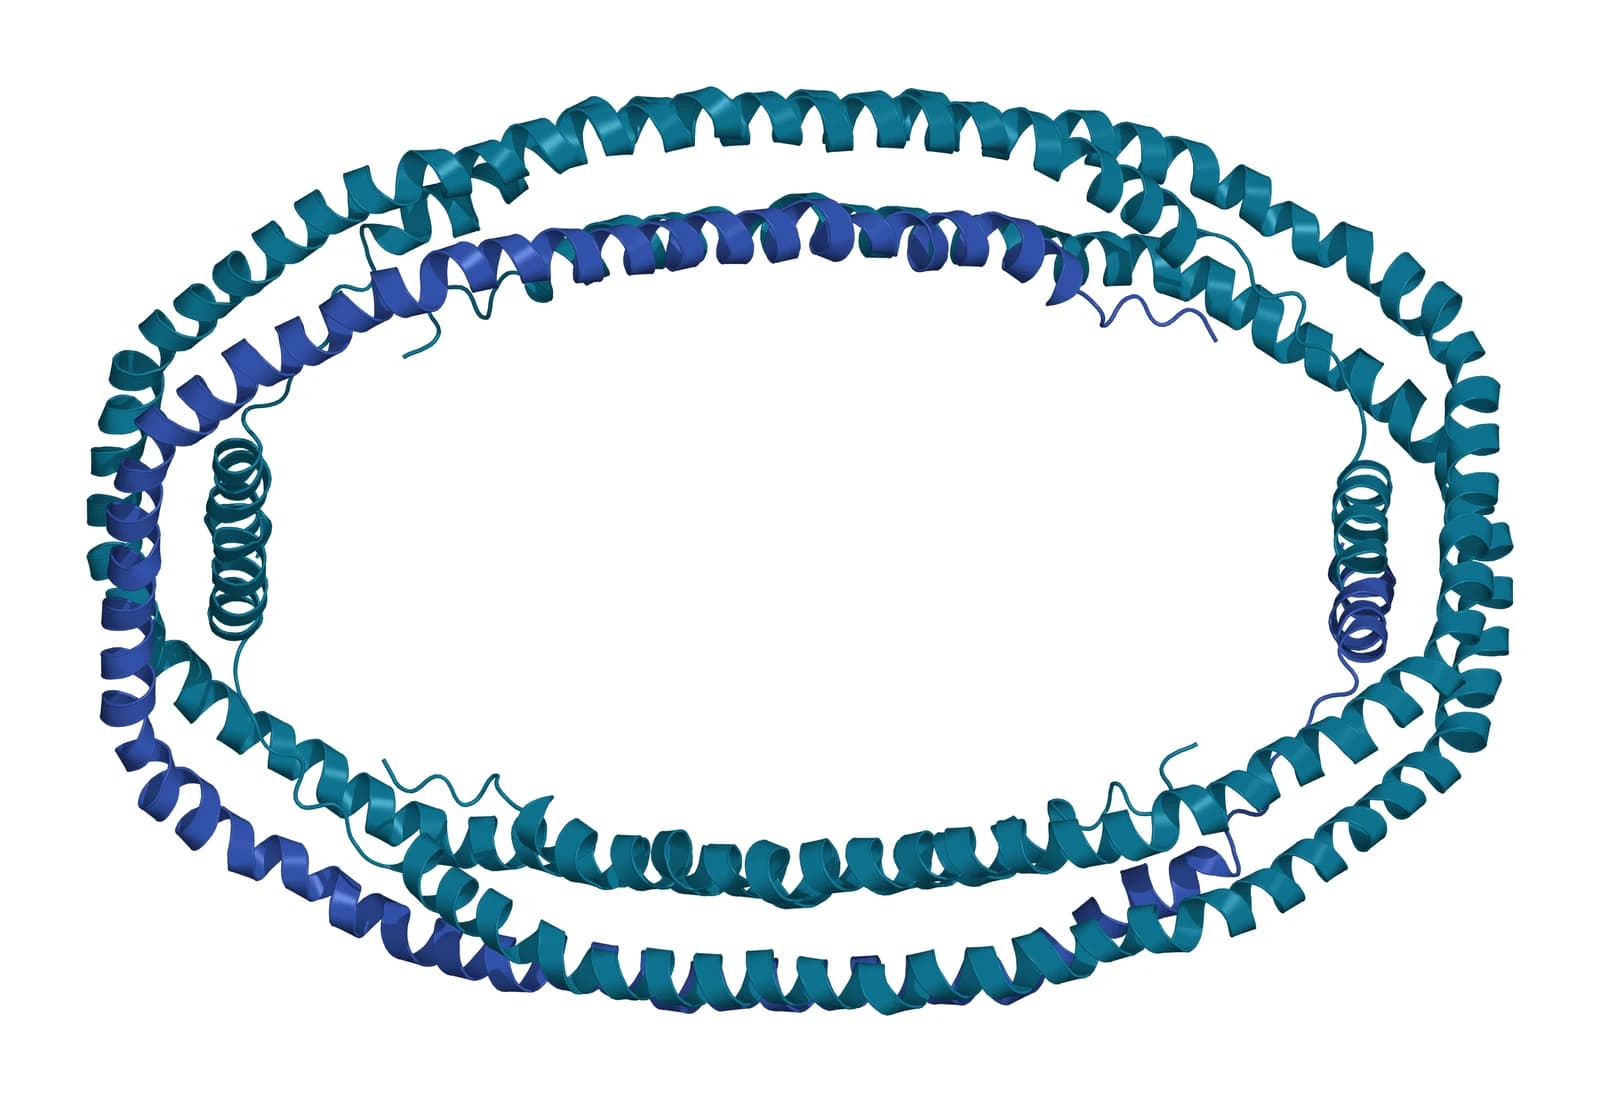
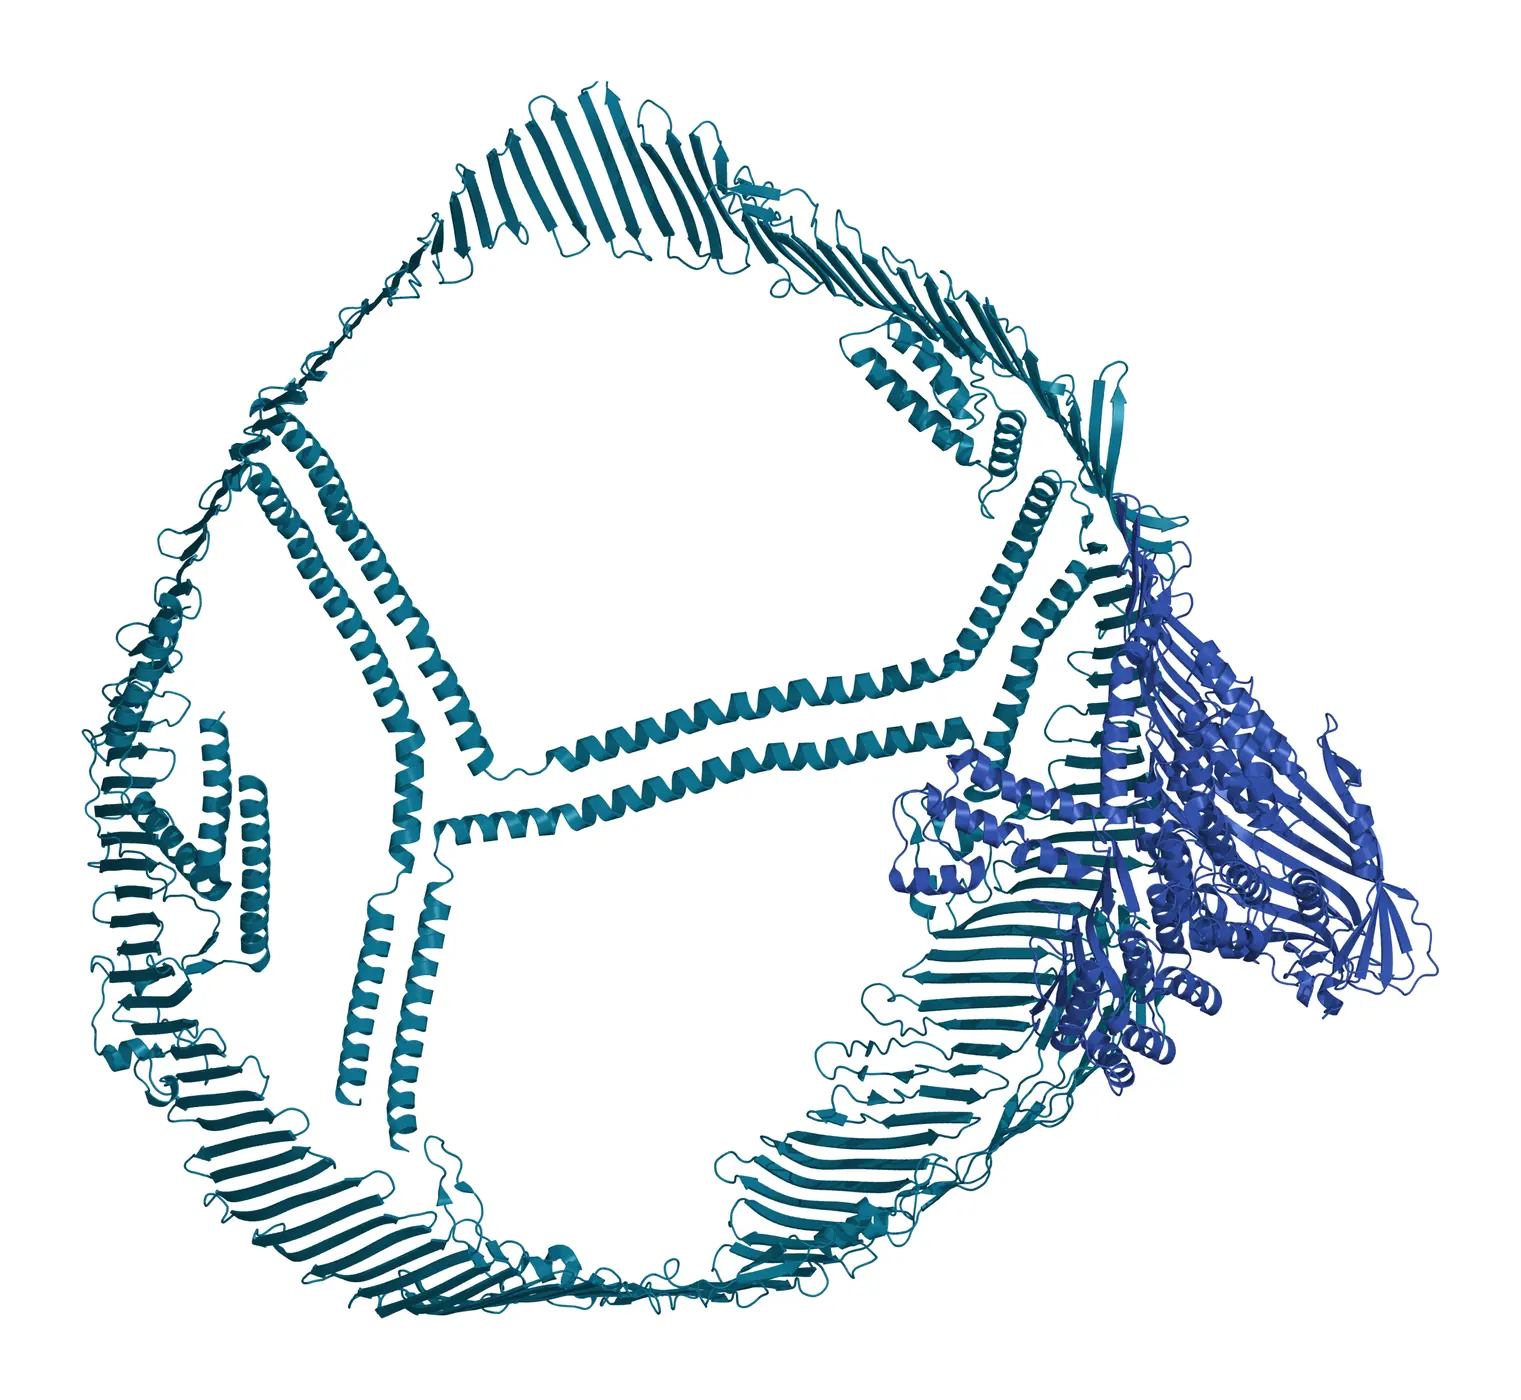
Fig. 3 | Apolipoprotein A-I (residues 44 to 243) and Apolipoprotein B100 from human LDL.
Soluble proteins, aggregates and culture supplements shape the ratio
Blood carries high concentrations of albumin, immunoglobulins and fibrinogen, which are generally smaller and denser than vesicles.[3] Karimi and colleagues described albumin as the main co-isolate of plasma vesicles prepared by ultracentrifugation, regardless of washing.[11]
Protein aggregates can also enter particle counts, as Webber and Clayton and later Brennan and colleagues noted.[1][15] Böing and colleagues reported aggregates co-isolated by differential centrifugation, and Linares and colleagues showed that high-speed centrifugation assembles vesicles of different phenotypes into mixed aggregates.[16][17]
Some plasma proteins bind vesicles directly. Tóth and colleagues found that vesicles incubated in plasma acquired a protein corona that included apolipoproteins A-I, B, C-III and E, complement factors and immunoglobulin chains, which raised their density.[18]
MISEV2023 concludes that some blood proteins and lipoproteins once defined as contaminants may be genuinely associated with vesicles and remain after gentle, rigorous separation. Their contribution to the protein term is then part of the vesicle itself.[3][18]
In culture, fetal bovine serum supplies vesicles of its own. Shelke and colleagues found that an 18 h ultracentrifugation removed about 95 percent of RNA-containing serum vesicles, and that a 1.5 h protocol was insufficient.[19]
MISEV2023 recommends processing and characterizing non-conditioned medium as a control, which shows how much the medium itself adds to vesicle measurements. Webber and Clayton used this control to set their background ratio.[1][3]
The isolation method largely sets the ratio a preparation reaches
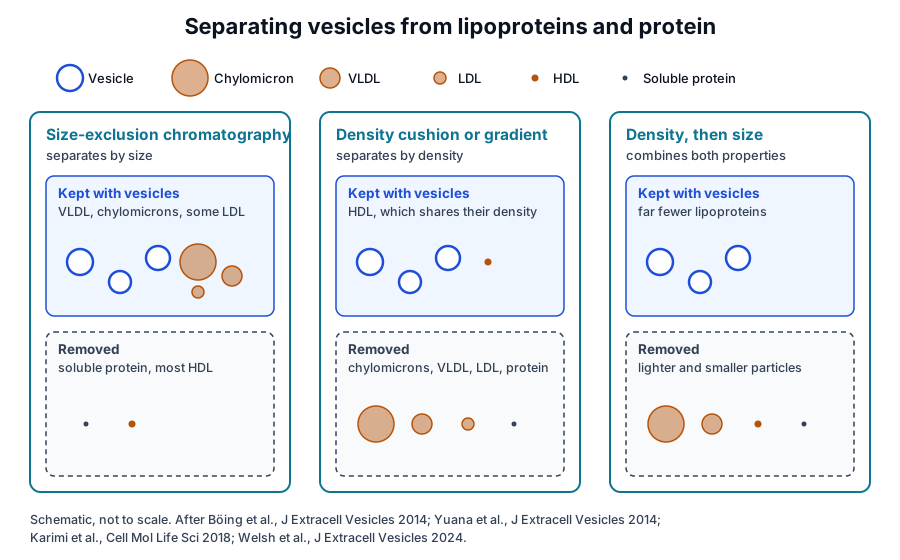
Lobb and colleagues compared four isolation methods on culture medium and plasma using resistive pulse sensing and protein assays. Polymer precipitation gave the highest particle yield and the lowest particle-to-protein ratio, while size-exclusion chromatography performed comparably to density gradient purification.[20]
Böing and colleagues showed what size-exclusion chromatography removes. Fractions 9 to 12 held 61 percent of platelet-derived vesicles with under 5 percent of HDL and under 1 percent of protein, enriching vesicles 8-fold over HDL and 70-fold over protein.[16]
Brennan and colleagues compared common methods on human serum. Size-exclusion columns and density gradient ultracentrifugation gave higher particle-to-protein ratios than the other methods, and plain ultracentrifugation gave a low ratio because of co-isolated protein.[15]
In culture medium, Benedikter and colleagues found that ultrafiltration followed by size-exclusion chromatography tended to give a higher yield and vesicle-to-protein purity than ultracentrifugation.[21] Kalra and colleagues reported that an iodixanol density gradient best removed abundant plasma proteins among three plasma methods.[22]
Combining separation principles addresses lipoproteins (Fig. 4). Karimi and colleagues floated plasma vesicles on an iodixanol cushion before size-exclusion chromatography, which reduced lipoprotein particles about 100-fold and allowed 1187 proteins to be identified in plasma vesicles.[11]
MISEV2023 asks for the measurements behind every ratio
MISEV2023 notes that total protein assays often overestimate vesicle concentration because of co-isolated protein, and that protein to particle ratios depend on the detection limits of each instrument. It therefore asks for absolute protein and particle concentrations alongside any reported ratio.[3]
- Report the original measurements behind a ratio, together with the ratio.[3]
- Report the lower concentration limit of detection of each assay.[3]
- Keep protein concentrations within the linear range of the reported reference curve.[3]
- State whether intact or disrupted vesicles were measured, including any detergent.[3]
- Report output as particles unless upstream processing is highly specific for vesicles.[3]
For lipid assays, the guidelines ask authors to state the detection limit and to consider how co-isolated particles such as lipoproteins influence the value.[3] Category 3 proteins, including apolipoproteins and albumin, give the matching protein-level readout of purity.[2][3]
The counting method defines the numerator of the ratio
A ratio is as comparable as the two assays that produce it. Bachurski and colleagues found that one tracking instrument reported bead concentrations 2.0 to 2.1-fold above their nominal values, while a second gave more accurate and repeatable vesicle concentrations.[23]
Both instruments in that study reported peak vesicle diameters of 60 nm or larger, while electron microscopy and interferometric imaging resolved smaller vesicles.[23] MISEV2023 notes that ratios depend on each instrument’s lower size limit, so they compare best within one counting method and setting.[3]
The denominator varies with the assay as well. Vergauwen and colleagues found that a fluorometric assay measured dilute vesicle and albumin samples most accurately, and that recovery after ultrafiltration depended on the filter membrane.[24]
Within one workflow, the ratio is a sensitive way to follow purity over time, and full reporting makes it interpretable between laboratories. Webber and Clayton anticipated that fluorescence-capable counting would refine the method by separating vesicles from other particles.[1][3]
Where to go from here
The particle counting reference compares tracking analysis with resistive pulse sensing, the two instruments behind most numerators. The protein marker reference covers the MISEV categories, and the isolation methods reference describes the separations that set each ratio.
The MISEV2023 compliance and certificate of analysis references show how purity data are documented. Verified practices can request lot documentation, and our team is glad to discuss the methods described on this page.
Annotated References
Numbered in the order they are cited in the text. Each source is annotated with what it supports on this page; peer-reviewed articles are listed with journal, volume, issue and pages, and primary sources are regulations, agency documents and reference databases.
- 1.Peer-reviewedWebber J, Clayton A. How pure are your vesicles? Journal of Extracellular Vesicles. 2013;2:19861. https://pubmed.ncbi.nlm.nih.gov/24009896/Annotation: Method proposal and spike-in validation of the particle-to-protein ratio. Cited for the albumin spike-in, the three purity ranges, the ratios reached by each preparation method and the stated assumptions.
- 2.Peer-reviewedThéry C, Witwer KW, Aikawa E, et al. Minimal information for studies of extracellular vesicles 2018 (MISEV2018): a position statement of the International Society for Extracellular Vesicles and update of the MISEV2014 guidelines. Journal of Extracellular Vesicles. 2018;7(1):1535750. https://pubmed.ncbi.nlm.nih.gov/30637094/Annotation: ISEV position statement. Cited for proposing protein to particle, protein to lipid and RNA to particle ratios as purity metrics and for grouping separation methods by recovery and specificity.
- 3.Peer-reviewedWelsh JA, Goberdhan DCI, O’Driscoll L, et al. Minimal information for studies of extracellular vesicles (MISEV2023): From basic to advanced approaches. Journal of Extracellular Vesicles. 2024;13(2):e12404. https://pubmed.ncbi.nlm.nih.gov/38326288/Annotation: Current ISEV guidelines. Cited for non-vesicular particles in biofluids, the lipoprotein overlap, the corona, the medium control and the reporting recommendations for protein, particle and lipid quantification.
- 4.Peer-reviewedOsteikoetxea X, Balogh A, Szabó-Taylor K, et al. Improved characterization of EV preparations based on protein to lipid ratio and lipid properties. PLoS One. 2015;10(3):e0121184. https://pubmed.ncbi.nlm.nih.gov/25798862/Annotation: Plate-based total lipid assay applied to vesicle subpopulations. Cited for characteristic protein to lipid ratios and their shift with vesicle damage or added protein.
- 5.Peer-reviewedVisnovitz T, Osteikoetxea X, Sódar BW, et al. An improved 96 well plate format lipid quantification assay for standardisation of experiments with extracellular vesicles. Journal of Extracellular Vesicles. 2019;8(1):1565263. https://pubmed.ncbi.nlm.nih.gov/30728922/Annotation: Optimization of the sulfo-phospho-vanillin lipid assay. Cited for the liposome standard, the tenfold gain in sensitivity and lipid-based quantification of vesicles.
- 6.Peer-reviewedMihály J, Deák R, Szigyártó IC, et al. Characterization of extracellular vesicles by IR spectroscopy: Fast and simple classification based on amide and CH stretching vibrations. Biochimica et Biophysica Acta. Biomembranes. 2017;1859(3):459-466. https://pubmed.ncbi.nlm.nih.gov/27989744/Annotation: Infrared spectroscopy of vesicle subpopulations. Cited for the spectroscopic protein to lipid ratio and its sensitivity to aggregates, lipoproteins and immune complexes.
- 7.Peer-reviewedGhosal S, Leporati R, Varga Á, et al. Cholesteryl esters and high protein-to-lipid ratios distinguish non-vesicular extracellular particles from extracellular vesicles. Cell Communication and Signaling. 2026;24(1):434. https://pubmed.ncbi.nlm.nih.gov/41992224/Annotation: Biochemical and lipidomic profiling of non-vesicular particles. Cited for their higher protein to lipid ratios and their cholesteryl ester and triacylglycerol content.
- 8.Peer-reviewedSimonsen JB. What Are We Looking At? Extracellular Vesicles, Lipoproteins, or Both? Circulation Research. 2017;121(8):920-922. https://pubmed.ncbi.nlm.nih.gov/28963190/Annotation: Viewpoint on lipoproteins in plasma vesicle studies. Cited with MISEV2023 for the size overlap of lipoproteins with vesicles and their far greater abundance.
- 9.Peer-reviewedSódar BW, Kittel Á, Pálóczi K, et al. Low-density lipoprotein mimics blood plasma-derived exosomes and microvesicles during isolation and detection. Scientific Reports. 2016;6:24316. https://pubmed.ncbi.nlm.nih.gov/27087061/Annotation: Flow cytometry and electron microscopy of plasma particles. Cited for LDL making up most vesicle-sized particles, co-purifying with vesicles and associating with them in vitro.
- 10.Peer-reviewedYuana Y, Levels J, Grootemaat A, et al. Co-isolation of extracellular vesicles and high-density lipoproteins using density gradient ultracentrifugation. Journal of Extracellular Vesicles. 2014;3:23262. https://pubmed.ncbi.nlm.nih.gov/25018865/Annotation: Density gradient fractionation of plasma lipoproteins. Cited for the shared density of HDL and vesicles and the vesicle to HDL particle ratio in the HDL fraction.
- 11.Peer-reviewedKarimi N, Cvjetkovic A, Jang SC, et al. Detailed analysis of the plasma extracellular vesicle proteome after separation from lipoproteins. Cellular and Molecular Life Sciences. 2018;75(15):2873-2886. https://pubmed.ncbi.nlm.nih.gov/29441425/Annotation: Density cushion and size-exclusion separation of plasma vesicles with proteomics. Cited for lipoprotein sizes, albumin as a co-isolate and the 100-fold reduction in lipoprotein particles.
- 12.DatabaseNCBI Gene 335, APOA1 apolipoprotein A1 (Homo sapiens). Accessed 20 October 2026. https://www.ncbi.nlm.nih.gov/gene/335
- 13.DatabaseNCBI Gene 338, APOB apolipoprotein B (Homo sapiens). Accessed 20 October 2026. https://www.ncbi.nlm.nih.gov/gene/338
- 14.Peer-reviewedBerndsen ZT, Cassidy CK. The structure of apolipoprotein B100 from human low-density lipoprotein. Nature. 2025;638(8051):836-843. https://pubmed.ncbi.nlm.nih.gov/39662503/Annotation: Integrative cryo-EM structure of apolipoprotein B100 on LDL. Cited for the globular N-terminal domain and the continuous beta-sheet belt that wraps the particle.
- 15.Peer-reviewedBrennan K, Martin K, FitzGerald SP, et al. A comparison of methods for the isolation and separation of extracellular vesicles from protein and lipid particles in human serum. Scientific Reports. 2020;10(1):1039. https://pubmed.ncbi.nlm.nih.gov/31974468/Annotation: Comparison of serum isolation methods by particle-to-protein ratio and lipoprotein markers. Cited for the ratios reached by size exclusion, density gradients and ultracentrifugation.
- 16.Peer-reviewedBöing AN, van der Pol E, Grootemaat AE, et al. Single-step isolation of extracellular vesicles by size-exclusion chromatography. Journal of Extracellular Vesicles. 2014;3:23430. https://pubmed.ncbi.nlm.nih.gov/25279113/Annotation: Size-exclusion chromatography of platelet concentrate supernatant. Cited for the separation of vesicles from HDL and protein and for protein aggregates co-isolated by centrifugation.
- 17.Peer-reviewedLinares R, Tan S, Gounou C, et al. High-speed centrifugation induces aggregation of extracellular vesicles. Journal of Extracellular Vesicles. 2015;4:29509. https://pubmed.ncbi.nlm.nih.gov/26700615/Annotation: Electron microscopy and flow cytometry of pelleted plasma vesicles. Cited for aggregates of mixed vesicle phenotypes formed by high-speed centrifugation.
- 18.Peer-reviewedTóth EÁ, Turiák L, Visnovitz T, et al. Formation of a protein corona on the surface of extracellular vesicles in blood plasma. Journal of Extracellular Vesicles. 2021;10(11):e12140. https://pubmed.ncbi.nlm.nih.gov/34520123/Annotation: Proteomics of vesicles incubated in vesicle-depleted plasma. Cited for the corona proteins, including apolipoproteins, and the higher density of coated vesicles.
- 19.Peer-reviewedShelke GV, Lässer C, Gho YS, et al. Importance of exosome depletion protocols to eliminate functional and RNA-containing extracellular vesicles from fetal bovine serum. Journal of Extracellular Vesicles. 2014;3:24783. https://pubmed.ncbi.nlm.nih.gov/25317276/Annotation: Comparison of serum vesicle depletion protocols. Cited for vesicles in fetal bovine serum and the share removed by long ultracentrifugation.
- 20.Peer-reviewedLobb RJ, Becker M, Wen SW, et al. Optimized exosome isolation protocol for cell culture supernatant and human plasma. Journal of Extracellular Vesicles. 2015;4:27031. https://pubmed.ncbi.nlm.nih.gov/26194179/Annotation: Comparison of four isolation methods by particle counts and protein. Cited for precipitation giving the lowest particle-to-protein ratio and size exclusion matching density gradients.
- 21.Peer-reviewedBenedikter BJ, Bouwman FG, Vajen T, et al. Ultrafiltration combined with size exclusion chromatography efficiently isolates extracellular vesicles from cell culture media for compositional and functional studies. Scientific Reports. 2017;7(1):15297. https://pubmed.ncbi.nlm.nih.gov/29127410/Annotation: Comparison of ultrafiltration with size exclusion and ultracentrifugation for culture medium. Cited for the higher yield and vesicle-to-protein purity of the combined method.
- 22.Peer-reviewedKalra H, Adda CG, Liem M, et al. Comparative proteomics evaluation of plasma exosome isolation techniques and assessment of the stability of exosomes in normal human blood plasma. Proteomics. 2013;13(22):3354-3364. https://pubmed.ncbi.nlm.nih.gov/24115447/Annotation: Proteomic comparison of three plasma isolation methods. Cited for the density gradient method best removing highly abundant plasma proteins.
- 23.Peer-reviewedBachurski D, Schuldner M, Nguyen PH, et al. Extracellular vesicle measurements with nanoparticle tracking analysis - An accuracy and repeatability comparison between NanoSight NS300 and ZetaView. Journal of Extracellular Vesicles. 2019;8(1):1596016. https://pubmed.ncbi.nlm.nih.gov/30988894/Annotation: Instrument comparison with beads, liposomes and vesicles. Cited for differences in concentration accuracy between tracking instruments and their lower size range.
- 24.Peer-reviewedVergauwen G, Dhondt B, Van Deun J, et al. Confounding factors of ultrafiltration and protein analysis in extracellular vesicle research. Scientific Reports. 2017;7(1):2704. https://pubmed.ncbi.nlm.nih.gov/28577337/Annotation: Comparison of centrifugal filters and protein assays for vesicle samples. Cited for assay-dependent protein values and filter-dependent recovery.
Cite this page
ExaVeyra Sciences Editorial Team. Extracellular Vesicle Purity: Particle-to-Protein Ratios. ExaVeyra Sciences; 20 October 2026. Available from: https://exaveyra.com/science/exosome-biochemistry/extracellular-vesicle-purity-ratios. Accessed [date accessed].
Figure sources
- 25.PDB 1AV1, Apolipoprotein A-I (residues 44 to 243). ExaVeyra Sciences, rendered in PyMOL from PDB 1AV1. Structure data: RCSB Protein Data Bank (rcsb.org), CC0. Structure publication: Borhani DW, Rogers DP, Engler JA, Brouillette CG. Crystal structure of truncated human apolipoprotein A-I suggests a lipid-bound conformation. Proc Natl Acad Sci U S A. 1997;94(23):12291-12296.
- 26.PDB 9E9R, The Structure of ApoB100 from Human Low-Density Lipoprotein. ExaVeyra Sciences, rendered in PyMOL from PDB 9E9R. Structure data: RCSB Protein Data Bank (rcsb.org), CC0. Structure publication: Berndsen ZT, Cassidy CK. The structure of apolipoprotein B100 from human low-density lipoprotein. Nature. 2025;638:836-843.