Extracellular Vesicle Isolation: Ultracentrifugation, SEC and TFF
By Benn Bluestein-Veyra, M.Sc. Organic Chemistry · Updated 20 October 2026
ExaVeyra Sciences is a Miami-based B2B supplier of exosomes for topical aesthetic use to licensed clinics, and it refers licensed prescribers to a 503A compounding pharmacy that prepares formulations against individual prescriptions.
| Question | Answer |
|---|---|
| What this page covers | How EV isolation methods compare: differential ultracentrifugation, density gradients, size-exclusion chromatography, tangential flow and affinity capture. |
| Who can order | Licensed clinics and practitioners whose active professional license and NPI ExaVeyra has verified. Exosome orders also require a signed professional-use acknowledgment. |
| What ships, and how | Exosome material for topical aesthetic use, characterized by lot, ships overnight in a cold chain. Delivery can take 1 to 3 business days. A certificate of analysis is issued for every lot and provided on request. |
Extracellular vesicle isolation methods separate vesicles from cells, debris, soluble protein and lipoproteins by exploiting one physical property at a time: sedimentation rate, buoyant density, size, solubility or a surface protein.[1] Each method trades recovery against purity and scale, and published comparisons measure that trade directly.[2][3]
This reference covers differential ultracentrifugation, density gradients, size-exclusion chromatography, tangential flow filtration, polymer precipitation and immunoaffinity capture. It then summarizes what side-by-side studies report and how the field records isolation choices through MISEV2023 and EV-TRACK.
Extracellular vesicle isolation methods exploit distinct physical properties
Vesicles share their size and density ranges with other particles in conditioned media and body fluids, so separation from non-vesicular particles is a central task of every study.[1] Théry and colleagues framed purification this way in their 2006 protocol, which pairs isolation from culture supernatants and fluids with tests of purity and homogeneity.[4]
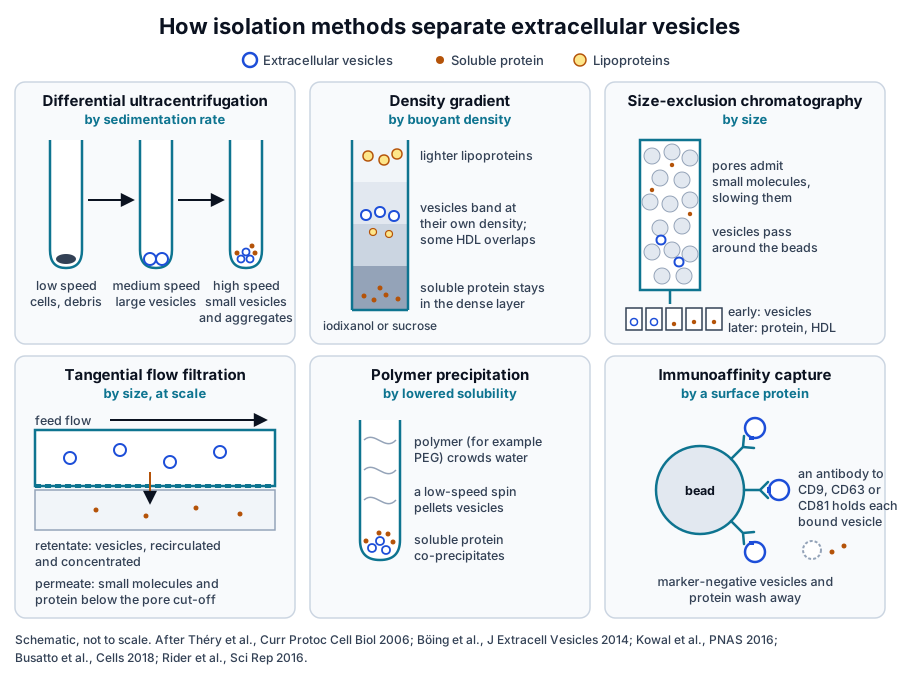
Sedimentation rate drives differential ultracentrifugation, buoyant density drives gradients, and size drives chromatography and filtration (Fig. 1).[4][5] Polymer precipitation acts on solubility, and immunoaffinity capture selects vesicles that carry a chosen surface protein.[6][7]
The 2016 worldwide survey led by Gardiner found conditioned cell culture media to be the most widely used starting material, at 83 percent of respondents. Sample volume, sample type and the intended downstream analysis all shaped which isolation method a laboratory chose.[8]
Differential ultracentrifugation separates vesicles by sedimentation rate
Differential ultracentrifugation applies increasing centrifugal force in sequence. Low-speed steps remove cells and debris, an intermediate step pellets larger vesicles, and a final high-speed step pellets small vesicles, which are then washed and pelleted again.[4]
It remains the most widely used method. Ultracentrifugation was used by 81 percent of respondents in the 2016 ISEV survey,[8] and the 2019 follow-up survey found ultracentrifugation and density gradients still the most common separation methods.[9]
Rotor type, run time and force shape the pellet
Cvjetkovic and colleagues compared swinging bucket and fixed angle rotors across run times. Pelleting of small vesicles depended on rotor type and run time as well as g-force; longer runs raised RNA and protein yield, and very long runs added excess protein to the pellet.[10]
Pelleting also packs particles together. Linares and colleagues showed by electron microscopy and flow cytometry that high-speed centrifugation formed aggregates of vesicles with mixed phenotypes,[11] and Lobb and colleagues reported that repeated ultracentrifugation steps lowered vesicle yield.[3]
In plasma, the high-speed pellet also collects protein aggregates. Böing and colleagues described this co-isolation as the motivation for a single-step chromatography method that separates vesicles from protein and lipoproteins.[5]
Density gradients resolve vesicles by buoyant density
Density gradient ultracentrifugation places a sample on top of, or beneath, a continuous or stepped gradient of iodixanol or sucrose. During centrifugation each particle moves to the layer that matches its own density, which separates membrane vesicles from denser protein complexes.[1]
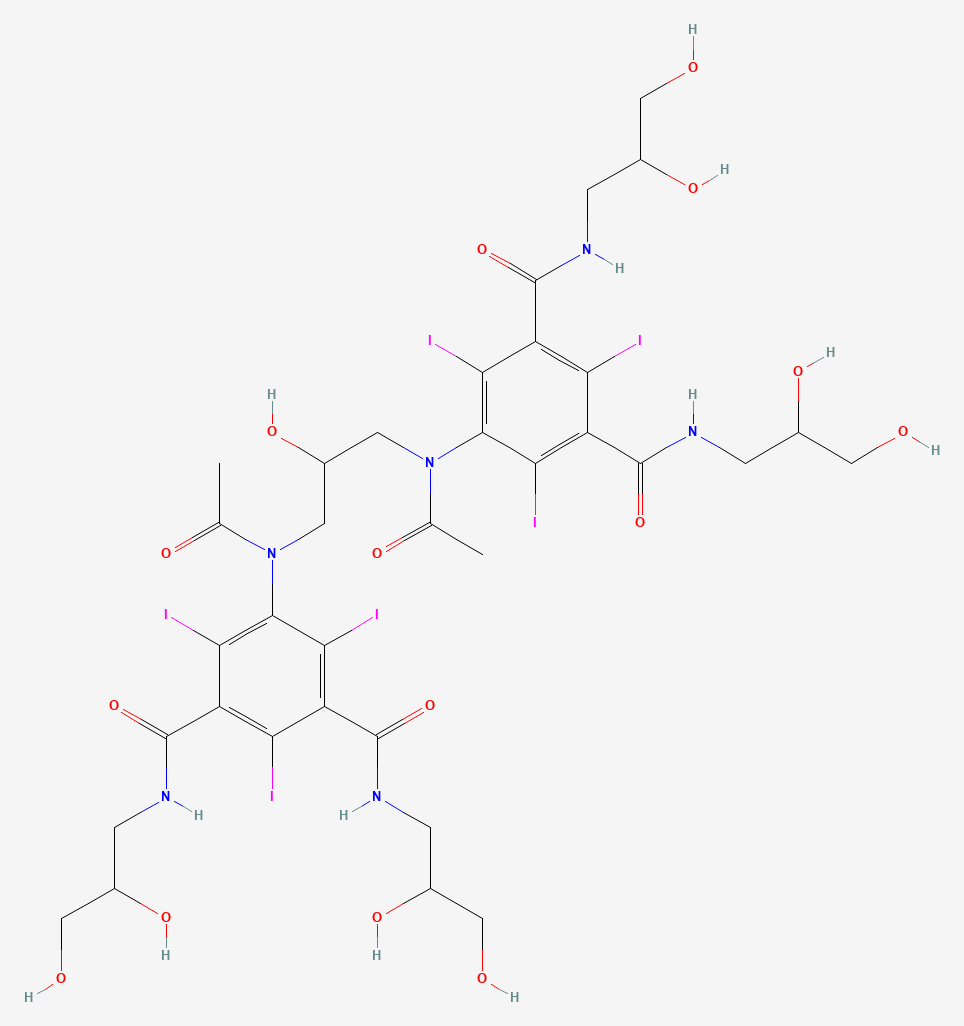
Iodixanol is a dimeric, non-ionic and iso-osmolar iodinated compound, developed as a radiographic contrast medium and widely used as a gradient medium (Fig. 2).[12] Its two tri-iodinated benzene rings give it the formula C35H44I6N6O15.[12]
Kowal and colleagues first separated dendritic cell vesicles by sedimentation speed and then floated them upward into iodixanol gradients. Quantitative proteomics showed that classical markers such as MHC, flotillin and HSP70 were present in all vesicle populations.[7]
Van Deun and colleagues compared an iodixanol density gradient with ultracentrifugation and two commercial precipitation reagents. The gradient gave the most CD63-positive vesicles and the strongest enrichment of exosomal marker proteins, and it separated vesicles from extracellular Argonaute-2 complexes.[2]
Jeppesen and colleagues combined high-resolution density gradient fractionation with direct immunoaffinity capture. They assigned Argonaute 1 to 4, glycolytic enzymes and cytoskeletal proteins to non-vesicular material and identified annexin A1 as a marker of microvesicles shed from the plasma membrane.[13]
Density separation is especially informative for blood. In an iodixanol gradient of rat plasma, Onódi and colleagues found vesicle markers at 1.128 to 1.174 grams per milliliter, a fraction that kept only 1.4 percent of the LDL and chylomicron marker and 3.0 percent of the HDL marker.[14]
Size-exclusion chromatography separates vesicles from soluble protein by size
Size-exclusion chromatography passes a sample through a bed of porous beads. Proteins and small molecules enter the pores and elute late, while vesicles larger than the pores travel around the beads and elute in the early fractions.[5]
Böing and colleagues ran platelet-free supernatant of platelet concentrates on a sepharose CL-2B column. The early fractions held 61 percent of the collected platelet-derived vesicles with under 5 percent of the HDL and under 1 percent of the protein, an 8-fold and 70-fold enrichment over each.[5]
Vesicle recovery in that study was 43 percent of the starting material.[5] Lobb and colleagues later compared four isolation techniques and found size exclusion comparable to density gradient purification.[3]
Gámez-Valero and colleagues reported that SEC removed most soluble plasma protein and was the only method in their comparison that allowed detection of CD9, CD63 and CD81. The authors suggested that precipitating agents may interfere with vesicle structure or composition.[15]
Lipoproteins are the main co-isolates in blood. Karimi and colleagues found vesicle markers in the same SEC fractions as lipoprotein particles, and adding a density cushion to SEC reduced lipoprotein particles 100-fold and allowed 1,187 proteins to be identified in plasma vesicles.[16]
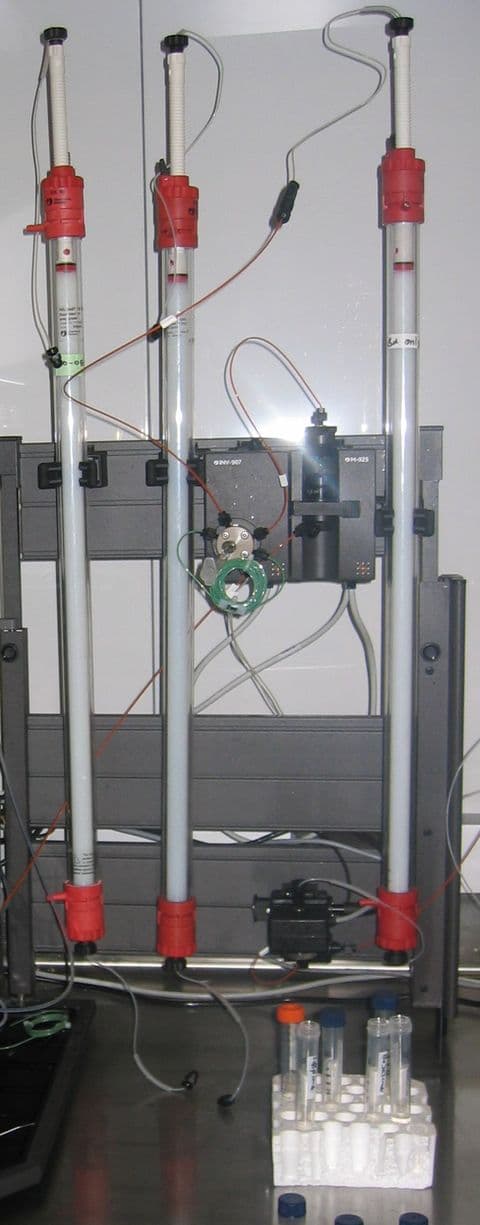
The equipment is simple: a column of porous resin, run by gravity or a low-pressure pump, with fractions collected in sequence below it (Fig. 3).[5]
Tangential flow filtration and chromatography scale isolation to large volumes
Tangential flow filtration sweeps the feed along the surface of a membrane. Vesicles larger than the pores stay in the recirculating retentate and become concentrated, while water, salts and small proteins pass through as permeate.[17]
Busatto and colleagues compared tangential flow filtration with ultracentrifugation for conditioned cell culture media. TFF concentrated vesicles of comparable physicochemical characteristics with higher yield, fewer free macromolecules and aggregates, and better batch-to-batch consistency in half the processing time.[17]
Haraszti and colleagues grew umbilical cord mesenchymal stem cells on microcarriers in three-dimensional culture. That culture raised exosome yield 20-fold over flat culture isolated by ultracentrifugation, and tangential flow filtration raised it a further 7-fold.[18]
Ultrafiltration offers a similar route at bench scale. Nordin and colleagues found that ultrafiltration followed by liquid chromatography gave a significantly higher vesicle yield than ultracentrifugation, with unchanged vesicle protein composition and preserved biophysical properties.[19]
Charge offers another handle. Heath and colleagues used the net negative charge of vesicles to isolate them by anion exchange chromatography, recovering 2.4 × 10¹¹ vesicles from 1 liter of culture supernatant, with less protein and debris than in tangential flow preparations.[20]
Precipitation and immunoaffinity capture select by solubility and by surface protein
Polymer precipitation favors yield
Polymers such as polyethylene glycol lower the solubility of vesicles so they pellet at low speed. Rider and colleagues developed this approach as ExtraPEG, which enriched vesicles from large volumes of media using low-speed centrifugation and one small-volume ultracentrifugation step.[6]
Comparative studies place precipitation at the high-yield, lower-purity end. Lobb and colleagues found precipitation gave the least pure preparations from both culture media and plasma,[3] and Van Deun and colleagues reported higher purity from density gradients than from commercial precipitation reagents.[2]
Gámez-Valero and colleagues found that PEG precipitation retained the abundant soluble plasma proteins that SEC removed. They advised matching the isolation method to the intended use of the vesicles.[15]
Immunoaffinity capture selects a marker-defined subset
Immunoaffinity capture binds vesicles through an antibody to a surface protein, most often one of the tetraspanins CD9, CD63 and CD81 (Fig. 4). Kowal and colleagues found exosomal and non-exosomal subpopulations within small vesicles and proposed immuno-isolation with CD63, CD81 or CD9 to separate them.[7]
CD63 is a tetraspanin glycoprotein encoded by a gene at human chromosome 12q13.2.[21] Jeppesen and colleagues used direct immunoaffinity capture to define the protein, RNA and DNA content of classical exosomes, separately from the non-vesicular material collected alongside them.[13]
Recovery by capture reflects the share of vesicles that carry the target, which varies between vesicle subtypes.[7] Immunoaffinity results therefore describe a defined subpopulation of the vesicles in a sample, which complements the bulk view given by density and size separation.[13]
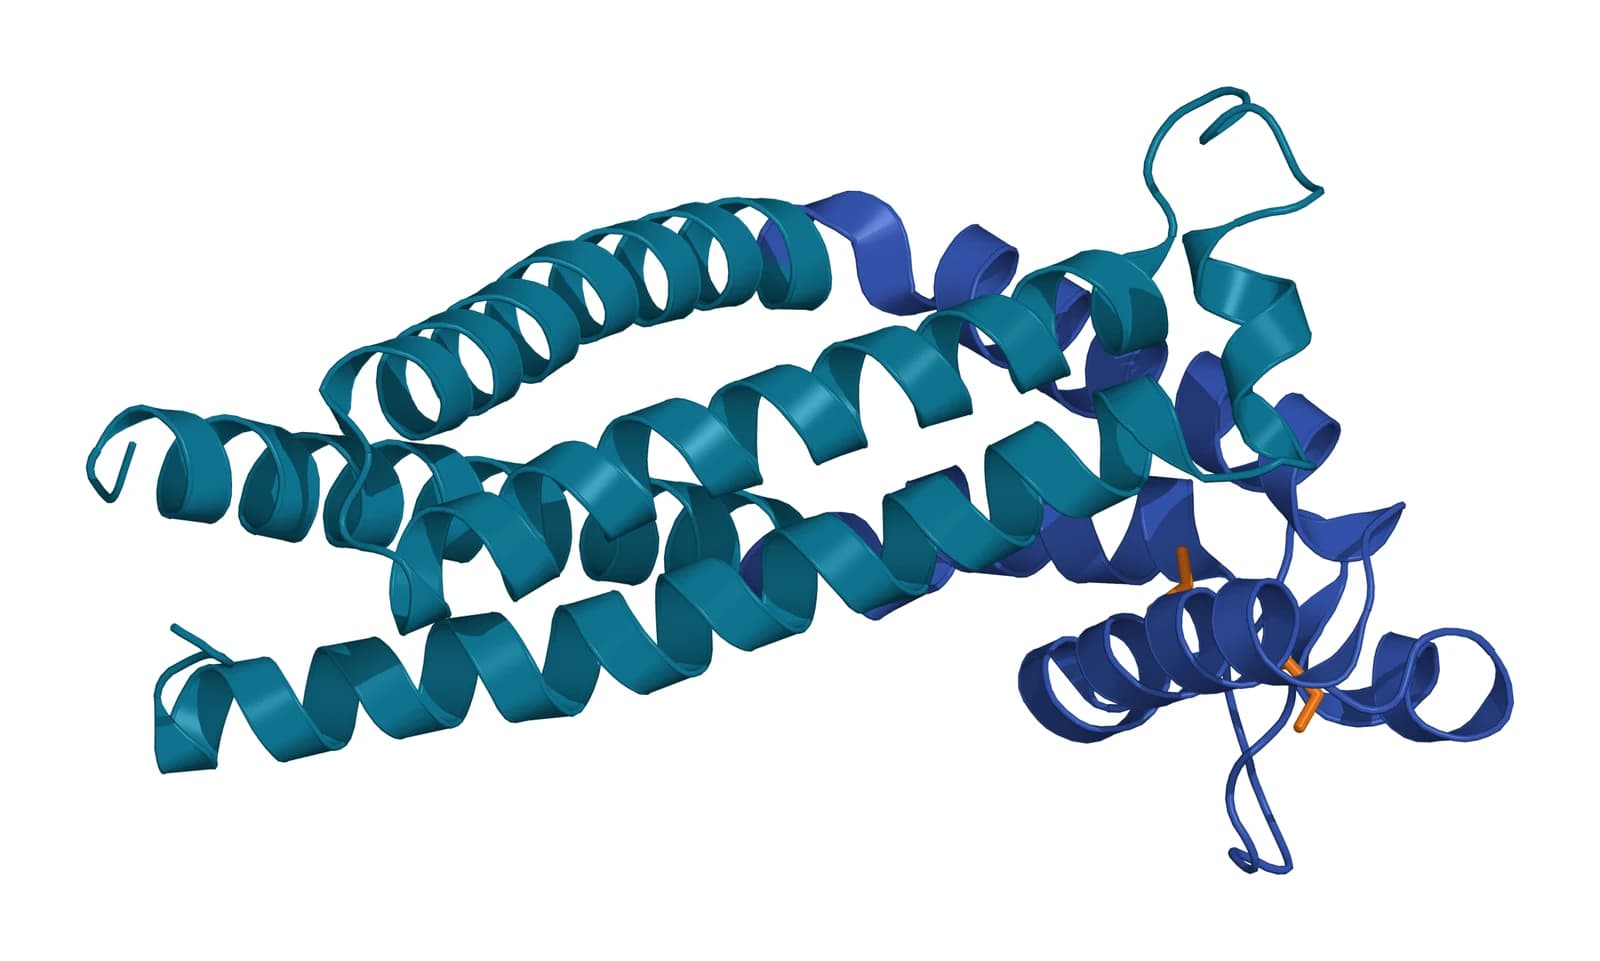
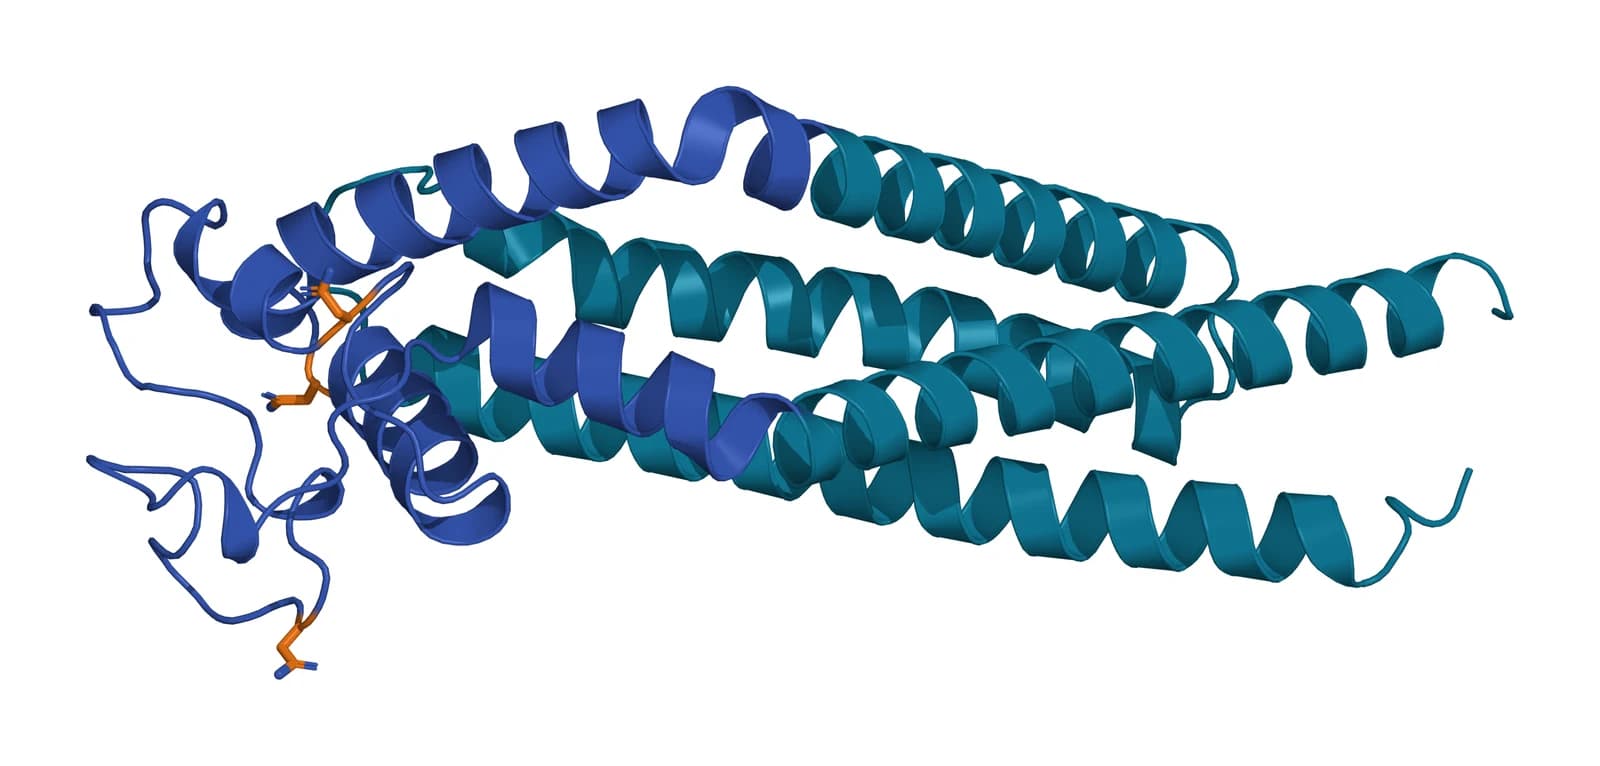
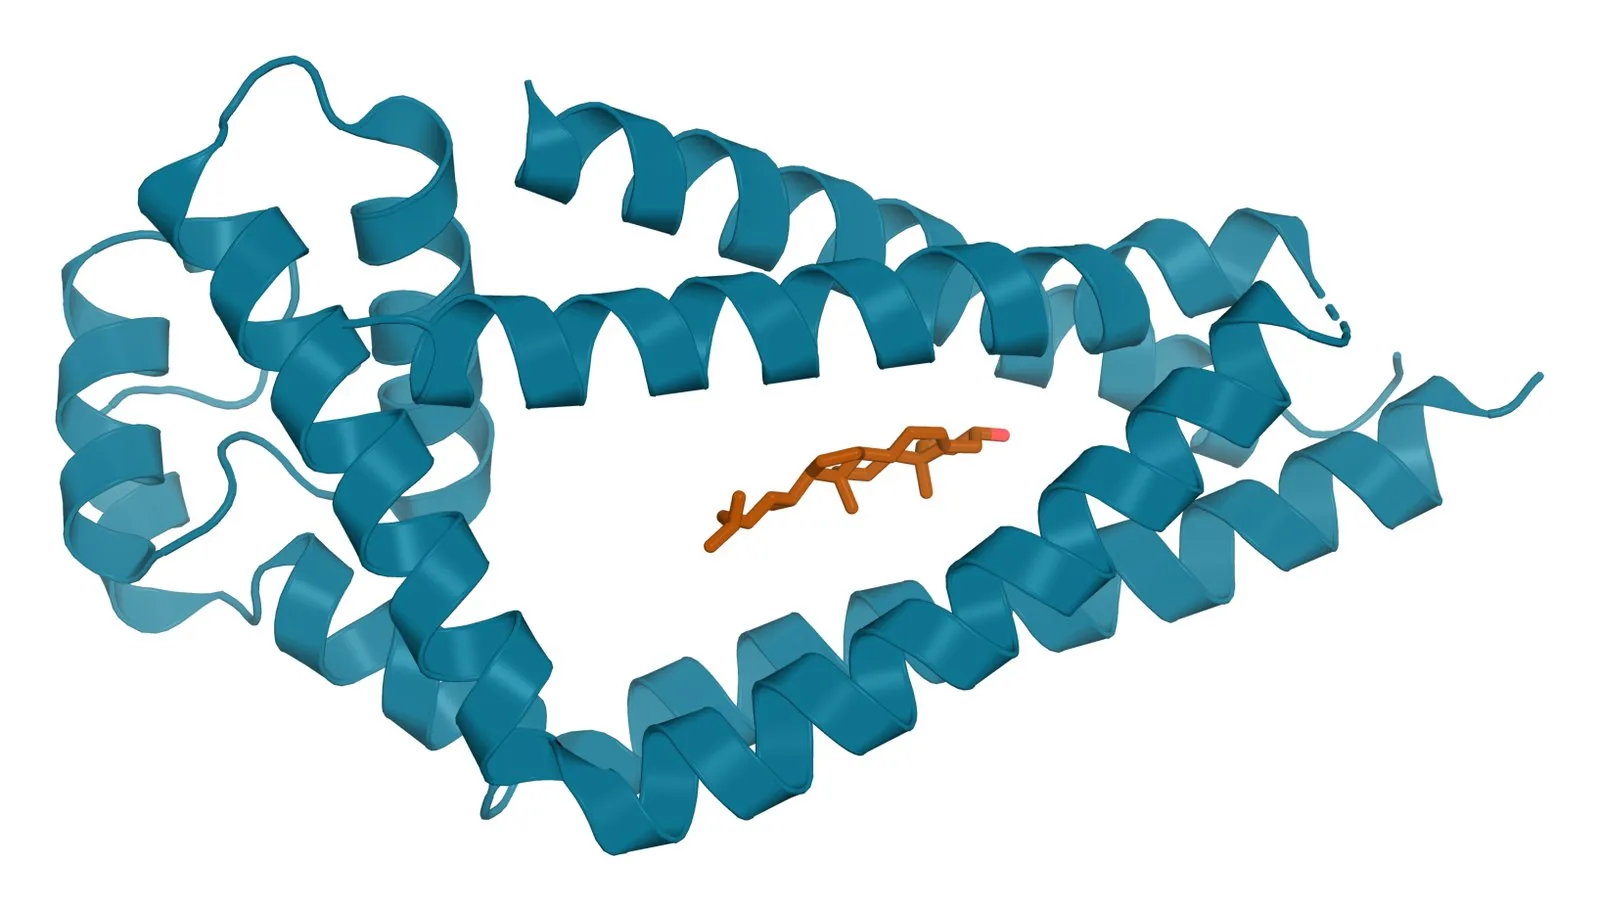
Fig. 4 | Tetraspanin CD9, Tetraspanin CD63 (predicted) and Tetraspanin CD81 with cholesterol.
Combined workflows and published comparisons map recovery against purity
Most laboratories combine methods. In the 2016 survey, 59 percent of respondents used more than one,[8] and the 2019 survey found rising use of size-exclusion chromatography, with tangential flow and microfluidic techniques each used by more than 10 percent of respondents.[9]
Benedikter and colleagues concentrated bronchial epithelial cell media by ultrafiltration and then ran size-exclusion chromatography. The UF-SEC vesicles tended toward higher yield and a higher vesicle-to-protein purity than ultracentrifuged vesicles, and the same run returned the vesicle-free secreted protein for comparison.[22]
For plasma, Onódi and colleagues followed an iodixanol gradient with bind-elute chromatography, which brought albumin and lipoprotein below the detection limit with a lower overall yield.[14] Brennan and colleagues compared common techniques alone and in combination on human serum and found that the procedure shaped yield, lipoprotein content and protein content.[23]
Asymmetric flow field-flow fractionation resolves subpopulations by size
Asymmetric flow field-flow fractionation separates particles in a thin channel against a perpendicular cross flow, with no packed stationary phase. Zhang and colleagues used it to resolve large exosome vesicles of 90 to 120 nm, small exosome vesicles of 60 to 80 nm, and non-membranous nanoparticles of about 35 nm that they named exomeres.[24]
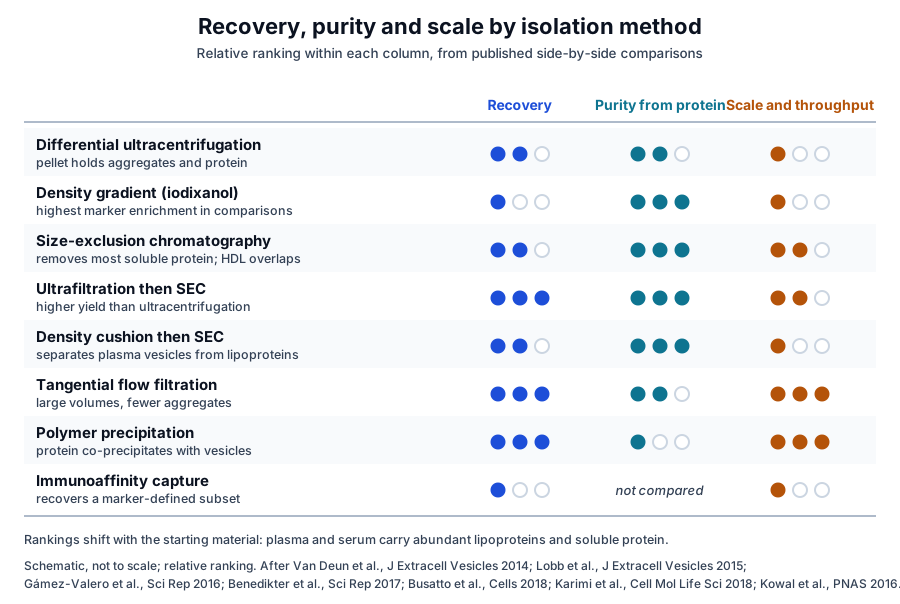
Across these comparisons a consistent pattern emerges. Precipitation and tangential flow favor recovery and scale, and SEC and combined workflows sit in the middle. Density gradients favor purity, and immunoaffinity capture isolates a marker-defined subset (Fig. 5).[2][3][22]
Purity ratios and EV-TRACK make isolation choices reportable
Webber and Clayton proposed a simple purity estimate: the ratio of vesicle counts from nanoparticle tracking to protein concentration from a colorimetric assay. They suggested it as a routine quality step that would let laboratories compare purity across studies.[25]
MISEV2023 summarizes the advantages and limitations of current approaches to producing, separating and characterizing vesicles from cell culture, body fluids and solid tissues.[1] It compiles feedback from ISEV task forces and more than 1,000 researchers.[1]
The EV-TRACK Consortium described its knowledgebase in 2017 as a crowdsourced resource that centralizes EV biology and methodology.[26] Its checklist for authors and editors makes the methods of EV experiments transparent, and the database supports queries and meta-analysis of published experiments.[27]
In the 2019 survey, most researchers said separation and characterization deserve more attention.[9] Reporting the isolation method with a purity ratio and marker data is how the field now compares preparations across laboratories.[1][25]
Where to go from here
The protein marker reference explains the MISEV categories that isolation studies measure, and the purity ratios reference covers particle-to-protein and related metrics in depth. The single-vesicle analysis reference describes how individual vesicles are counted and phenotyped after isolation.
The quality references on NTA and MRPS particle counting and on how exosomes are tested show how these measurements appear in supplier documentation. Verified practices can request lot documentation, and our team is glad to discuss the methods described on this page.
Annotated References
Numbered in the order they are cited in the text. Each source is annotated with what it supports on this page; peer-reviewed articles are listed with journal, volume, issue and pages, and primary sources are regulations, agency documents and reference databases.
- 1.Peer-reviewedWelsh JA, Goberdhan DCI, O’Driscoll L, et al. Minimal information for studies of extracellular vesicles (MISEV2023): From basic to advanced approaches. Journal of Extracellular Vesicles. 2024;13(2):e12404. https://pubmed.ncbi.nlm.nih.gov/38326288/Annotation: ISEV position statement on EV research. Cited for separation from non-vesicular particles as a central task, the principles of density separation, the place of immunoaffinity methods, and its summary of current separation approaches.
- 2.Peer-reviewedVan Deun J, Mestdagh P, Sormunen R, et al. The impact of disparate isolation methods for extracellular vesicles on downstream RNA profiling. Journal of Extracellular Vesicles. 2014;3:24858. https://pubmed.ncbi.nlm.nih.gov/25317274/Annotation: Comparison of an iodixanol gradient, ultracentrifugation and two precipitation reagents. Cited for the gradient giving the most CD63-positive vesicles, the strongest marker enrichment and separation from Argonaute-2 complexes.
- 3.Peer-reviewedLobb RJ, Becker M, Wen SW, et al. Optimized exosome isolation protocol for cell culture supernatant and human plasma. Journal of Extracellular Vesicles. 2015;4:27031. https://pubmed.ncbi.nlm.nih.gov/26194179/Annotation: Comparison of four isolation techniques on culture media and plasma. Cited for lower yield after repeated ultracentrifugation, the low purity of precipitation and SEC performing comparably to density gradients.
- 4.Peer-reviewedThéry C, Amigorena S, Raposo G, et al. Isolation and characterization of exosomes from cell culture supernatants and biological fluids. Current Protocols in Cell Biology. 2006;Chapter 3:Unit 3.22. https://pubmed.ncbi.nlm.nih.gov/18228490/Annotation: The widely adopted methods unit on exosome purification. Cited for sequential differential ultracentrifugation and for pairing isolation with tests of purity and homogeneity.
- 5.Peer-reviewedBöing AN, van der Pol E, Grootemaat AE, et al. Single-step isolation of extracellular vesicles by size-exclusion chromatography. Journal of Extracellular Vesicles. 2014;3:23430. https://pubmed.ncbi.nlm.nih.gov/25279113/Annotation: Size-exclusion chromatography of platelet concentrate supernatant on sepharose CL-2B. Cited for the elution order, vesicle recovery of 43 percent and the enrichment over HDL and protein.
- 6.Peer-reviewedRider MA, Hurwitz SN, Meckes DG Jr. ExtraPEG: A Polyethylene Glycol-Based Method for Enrichment of Extracellular Vesicles. Scientific Reports. 2016;6:23978. https://pubmed.ncbi.nlm.nih.gov/27068479/Annotation: Development of a polyethylene glycol enrichment method. Cited for low-speed pelleting of vesicles from large volumes followed by one small-volume ultracentrifugation step.
- 7.Peer-reviewedKowal J, Arras G, Colombo M, et al. Proteomic comparison defines novel markers to characterize heterogeneous populations of extracellular vesicle subtypes. Proceedings of the National Academy of Sciences of the United States of America. 2016;113(8):E968-E977. https://pubmed.ncbi.nlm.nih.gov/26858453/Annotation: Proteomic comparison of dendritic cell vesicles separated by sedimentation, iodixanol flotation and immuno-isolation. Cited for markers shared by all vesicles and for immuno-isolation with CD63, CD81 or CD9.
- 8.Peer-reviewedGardiner C, Di Vizio D, Sahoo S, et al. Techniques used for the isolation and characterization of extracellular vesicles: results of a worldwide survey. Journal of Extracellular Vesicles. 2016;5:32945. https://pubmed.ncbi.nlm.nih.gov/27802845/Annotation: ISEV worldwide survey of laboratory practice. Cited for ultracentrifugation used by 81 percent of respondents, 59 percent combining methods, culture media as the main starting material, and the factors that shape method choice.
- 9.Peer-reviewedRoyo F, Théry C, Falcón-Pérez JM, et al. Methods for Separation and Characterization of Extracellular Vesicles: Results of a Worldwide Survey Performed by the ISEV Rigor and Standardization Subcommittee. Cells. 2020;9(9):1955. https://pubmed.ncbi.nlm.nih.gov/32854228/Annotation: Second ISEV worldwide survey, run in 2019. Cited for ultracentrifugation and density gradients remaining most common, rising SEC use, tangential flow and microfluidics above 10 percent, and the call for more attention to separation.
- 10.Peer-reviewedCvjetkovic A, Lötvall J, Lässer C. The influence of rotor type and centrifugation time on the yield and purity of extracellular vesicles. Journal of Extracellular Vesicles. 2014;3:23111. https://pubmed.ncbi.nlm.nih.gov/24678386/Annotation: Comparison of swinging bucket and fixed angle rotors across run times. Cited for rotor type and run time shaping pelleting and for longer runs raising yield along with protein content.
- 11.Peer-reviewedLinares R, Tan S, Gounou C, et al. High-speed centrifugation induces aggregation of extracellular vesicles. Journal of Extracellular Vesicles. 2015;4:29509. https://pubmed.ncbi.nlm.nih.gov/26700615/Annotation: Electron microscopy, immunogold labeling and flow cytometry of pelleted vesicles. Cited for aggregates of vesicles with mixed phenotypes after high-speed centrifugation.
- 12.DatabasePubChem CID 3724, Iodixanol. Accessed 20 October 2026. https://pubchem.ncbi.nlm.nih.gov/compound/3724
- 13.Peer-reviewedJeppesen DK, Fenix AM, Franklin JL, et al. Reassessment of Exosome Composition. Cell. 2019;177(2):428-445.e18. https://pubmed.ncbi.nlm.nih.gov/30951670/Annotation: High-resolution density gradient fractionation with direct immunoaffinity capture. Cited for assigning Argonaute proteins, glycolytic enzymes and cytoskeletal proteins to non-vesicular material and for annexin A1 as a microvesicle marker.
- 14.Peer-reviewedOnódi Z, Pelyhe C, Terézia Nagy C, et al. Isolation of High-Purity Extracellular Vesicles by the Combination of Iodixanol Density Gradient Ultracentrifugation and Bind-Elute Chromatography From Blood Plasma. Frontiers in Physiology. 2018;9:1479. https://pubmed.ncbi.nlm.nih.gov/30405435/Annotation: Iodixanol gradient and bind-elute chromatography of rat plasma. Cited for the density of the vesicle-rich fraction, its low lipoprotein content, and the purity gained by bind-elute chromatography at lower yield.
- 15.Peer-reviewedGámez-Valero A, Monguió-Tortajada M, Carreras-Planella L, et al. Size-Exclusion Chromatography-based isolation minimally alters Extracellular Vesicles' characteristics compared to precipitating agents. Scientific Reports. 2016;6:33641. https://pubmed.ncbi.nlm.nih.gov/27640641/Annotation: Comparison of SEC with PEG and organic solvent precipitation on plasma. Cited for SEC removing most soluble protein and allowing detection of CD9, CD63 and CD81.
- 16.Peer-reviewedKarimi N, Cvjetkovic A, Jang SC, et al. Detailed analysis of the plasma extracellular vesicle proteome after separation from lipoproteins. Cellular and Molecular Life Sciences. 2018;75(15):2873-2886. https://pubmed.ncbi.nlm.nih.gov/29441425/Annotation: SEC with and without a density cushion on plasma and serum. Cited for vesicles co-eluting with lipoprotein particles, the 100-fold reduction from adding a cushion, and 1,187 plasma vesicle proteins.
- 17.Peer-reviewedBusatto S, Vilanilam G, Ticer T, et al. Tangential Flow Filtration for Highly Efficient Concentration of Extracellular Vesicles from Large Volumes of Fluid. Cells. 2018;7(12):273. https://pubmed.ncbi.nlm.nih.gov/30558352/Annotation: Comparison of tangential flow filtration with ultracentrifugation for conditioned media. Cited for higher yield, fewer free macromolecules and aggregates, and better batch consistency in less time.
- 18.Peer-reviewedHaraszti RA, Miller R, Stoppato M, et al. Exosomes Produced from 3D Cultures of MSCs by Tangential Flow Filtration Show Higher Yield and Improved Activity. Molecular Therapy. 2018;26(12):2838-2847. https://pubmed.ncbi.nlm.nih.gov/30341012/Annotation: Yield comparison for umbilical cord mesenchymal stem cell exosomes. Cited for the 20-fold gain from microcarrier 3D culture and the further 7-fold gain from tangential flow filtration over ultracentrifugation.
- 19.Peer-reviewedNordin JZ, Lee Y, Vader P, et al. Ultrafiltration with size-exclusion liquid chromatography for high yield isolation of extracellular vesicles preserving intact biophysical and functional properties. Nanomedicine: Nanotechnology, Biology, and Medicine. 2015;11(4):879-883. https://pubmed.ncbi.nlm.nih.gov/25659648/Annotation: Comparison of ultrafiltration with liquid chromatography and ultracentrifugation. Cited for higher vesicle yield with unchanged protein composition and preserved biophysical properties.
- 20.Peer-reviewedHeath N, Grant L, De Oliveira TM, et al. Rapid isolation and enrichment of extracellular vesicle preparations using anion exchange chromatography. Scientific Reports. 2018;8(1):5730. https://pubmed.ncbi.nlm.nih.gov/29636530/Annotation: Comparison of anion exchange chromatography with ultracentrifugation and tangential flow filtration. Cited for isolation by net negative charge, the yield from one liter of supernatant, and lower protein and debris than TFF.
- 21.DatabaseNCBI Gene 967, CD63 molecule (Homo sapiens). Accessed 20 October 2026. https://www.ncbi.nlm.nih.gov/gene/967
- 22.Peer-reviewedBenedikter BJ, Bouwman FG, Vajen T, et al. Ultrafiltration combined with size exclusion chromatography efficiently isolates extracellular vesicles from cell culture media for compositional and functional studies. Scientific Reports. 2017;7(1):15297. https://pubmed.ncbi.nlm.nih.gov/29127410/Annotation: Comparison of UF-SEC with ultracentrifugation for bronchial epithelial cell media. Cited for higher yield and vesicle-to-protein purity and for recovering the vesicle-free secreted protein.
- 23.Peer-reviewedBrennan K, Martin K, FitzGerald SP, et al. A comparison of methods for the isolation and separation of extracellular vesicles from protein and lipid particles in human serum. Scientific Reports. 2020;10(1):1039. https://pubmed.ncbi.nlm.nih.gov/31974468/Annotation: Comparison of common isolation techniques, alone and combined, on human serum. Cited for the isolation procedure shaping yield, lipoprotein content and protein content.
- 24.Peer-reviewedZhang H, Freitas D, Kim HS, et al. Identification of distinct nanoparticles and subsets of extracellular vesicles by asymmetric flow field-flow fractionation. Nature Cell Biology. 2018;20(3):332-343. https://pubmed.ncbi.nlm.nih.gov/29459780/Annotation: Asymmetric flow field-flow fractionation of secreted nanoparticles. Cited for resolving large and small exosome vesicles and the smaller non-membranous exomeres by size.
- 25.Peer-reviewedWebber J, Clayton A. How pure are your vesicles? Journal of Extracellular Vesicles. 2013;2:19861. https://pubmed.ncbi.nlm.nih.gov/24009896/Annotation: Proposal and measurement of a particle-to-protein purity ratio. Cited for the ratio of nanoparticle tracking counts to protein concentration as a routine purity estimate.
- 26.Peer-reviewedEV-TRACK Consortium, Van Deun J, Mestdagh P, et al. EV-TRACK: transparent reporting and centralizing knowledge in extracellular vesicle research. Nature Methods. 2017;14(3):228-232. https://pubmed.ncbi.nlm.nih.gov/28245209/Annotation: Description of the EV-TRACK knowledgebase. Cited for the crowdsourced resource that centralizes EV biology and methodology.
- 27.Peer-reviewedVan Deun J, Hendrix A, EV-TRACK consortium. Is your article EV-TRACKed? Journal of Extracellular Vesicles. 2017;6(1):1379835. https://pubmed.ncbi.nlm.nih.gov/29184624/Annotation: Editorial introducing the EV-TRACK checklist. Cited for the checklist for authors and editors and for queries and meta-analysis of EV experiments.
Cite this page
ExaVeyra Sciences Editorial Team. Extracellular Vesicle Isolation: Ultracentrifugation, SEC and TFF. ExaVeyra Sciences; 20 October 2026. Available from: https://exaveyra.com/science/exosome-biochemistry/extracellular-vesicle-isolation-methods. Accessed [date accessed].
Figure sources
- 28.PubChem CID 3724, Iodixanol. National Center for Biotechnology Information, PubChem. Public domain.
- 29.PDB 6K4J, Tetraspanin CD9. ExaVeyra Sciences, rendered in PyMOL from PDB 6K4J. Structure data: RCSB Protein Data Bank (rcsb.org), CC0. Structure publication: Umeda R, Satouh Y, Takemoto M, et al. Structural insights into tetraspanin CD9 function. Nat Commun. 2020;11(1):1606.
- 30.AlphaFold model AF-P08962-F1, Tetraspanin CD63 (predicted). ExaVeyra Sciences, rendered in PyMOL from AlphaFold Protein Structure Database model AF-P08962-F1 (EMBL-EBI and Google DeepMind), CC BY 4.0. Structure publication: Jumper J, Evans R, Pritzel A, et al. Highly accurate protein structure prediction with AlphaFold. Nature. 2021;596(7873):583-589.
- 31.PDB 5TCX, Tetraspanin CD81 with cholesterol. ExaVeyra Sciences, rendered in PyMOL from PDB 5TCX. Structure data: RCSB Protein Data Bank (rcsb.org), CC0. Structure publication: Zimmerman B, Kelly B, McMillan BJ, et al. Crystal structure of a full-length human tetraspanin reveals a cholesterol-binding pocket. Cell. 2016;167(4):1041-1051.e11.