Single-Vesicle Analysis: Cryo-EM, Super-Resolution and Flow
By Benn Bluestein-Veyra, M.Sc. Organic Chemistry · Updated 20 October 2026
ExaVeyra Sciences is a Miami-based B2B supplier of exosomes for topical aesthetic use to licensed clinics, and it refers licensed prescribers to a 503A compounding pharmacy that prepares formulations against individual prescriptions.
| Question | Answer |
|---|---|
| What this page covers | Methods that read extracellular vesicles one at a time: cryo-EM, super-resolution microscopy, high-sensitivity flow cytometry and interferometric imaging. |
| Who can order | Licensed clinics and practitioners whose active professional license and NPI ExaVeyra has verified. Exosome orders also require a signed professional-use acknowledgment. |
| What ships, and how | Exosome material for topical aesthetic use, characterized by lot, ships overnight in a cold chain. Delivery can take 1 to 3 business days. A certificate of analysis is issued for every lot and provided on request. |
Single extracellular vesicle analysis measures size, shape, surface proteins or chemistry on each vesicle in a preparation, one particle at a time.[1] It resolves the subpopulations that a western blot or a protein assay averages into one value, and electron microscopy shows those populations to be highly diverse.[2]
This reference covers cryo-electron microscopy, super-resolution microscopy, high-sensitivity and imaging flow cytometry, interferometric imaging, atomic force microscopy and Raman spectroscopy. It describes what each method measures, what published comparisons report, and how the field reports single-vesicle data.
Single extracellular vesicle analysis resolves what bulk measurements average
Vesicles released by one cell type differ in size, shape and membrane content. Zabeo and colleagues imaged exosomes purified from the human mast cell line HMC-1 with several electron microscopy techniques and sorted them into nine categories by size and shape.[2]
Their findings called for a more precise way of defining exosome subpopulations, and single-particle methods now provide it.[2] MISEV2023, the guidance of the International Society for Extracellular Vesicles, summarizes these approaches with their advantages and limitations for characterization.[1]
The methods differ in the smallest vesicle each one detects and in what it reads from that vesicle (Fig. 1). Reported lower limits run from 20 to 30 nm for dSTORM to about 270 to 600 nm for conventional scatter-based flow cytometry.[3][4]
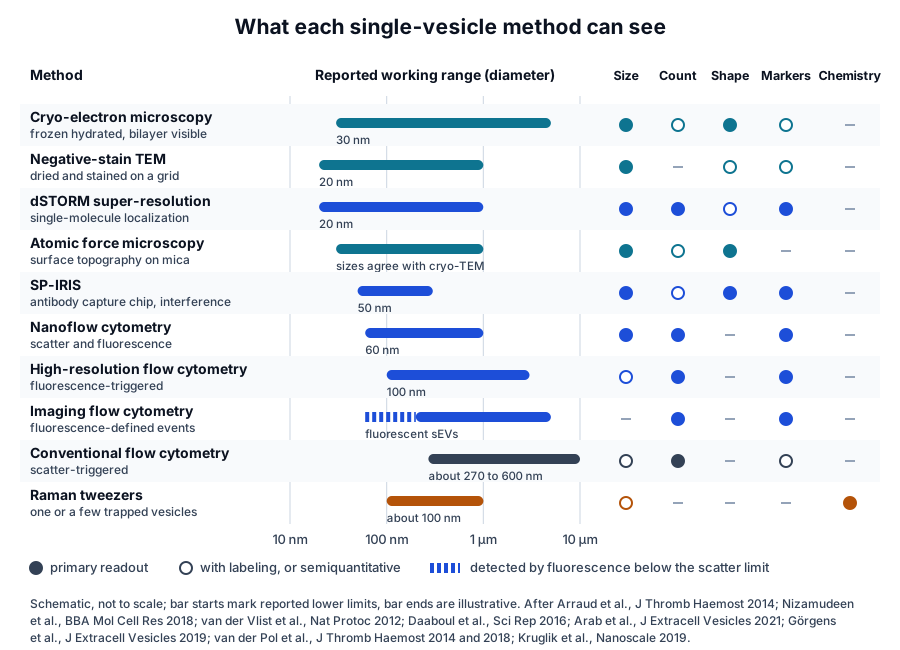
Cryo-electron microscopy shows the bilayer and morphology of each vesicle
Cryo-electron microscopy is regarded as a reference technique for vesicle size and morphology.[5] Tatischeff and colleagues described it as outstanding for morphological characterization, including the observation of vesicle heterogeneity within a sample.[6]
Arraud and colleagues combined cryo-electron microscopy with receptor-specific gold labeling to describe vesicles in plasma from healthy donors. They found spherical vesicles of 30 nm to 1 µm, tubular vesicles 1 to 5 µm long and membrane fragments, and only a minority exposed phosphatidylserine.[7]
The same group quantified vesicles from activated platelets by cryo-electron microscopy and immunogold labeling. About half measured 50 to 400 nm, and CD63 marked two populations: large vesicles with low labeling density and small vesicles with high labeling density.[8]
Immunogold labeling made the phenotype part of the image. About 60 percent of vesicles from platelets activated with TRAP or CRP-XL exposed the platelet marker CD41, most of them also phosphatidylserine, and the authors proposed several routes of formation to account for the rest.[8]
Höög and Lötvall imaged human ejaculate directly by cryo-electron microscopy and tomography, with no centrifugation, fixation, sectioning or heavy-metal stain. They categorized about 1,500 extracellular structures into five major vesicle subcategories and six subcategories of other membrane compartments.[9]
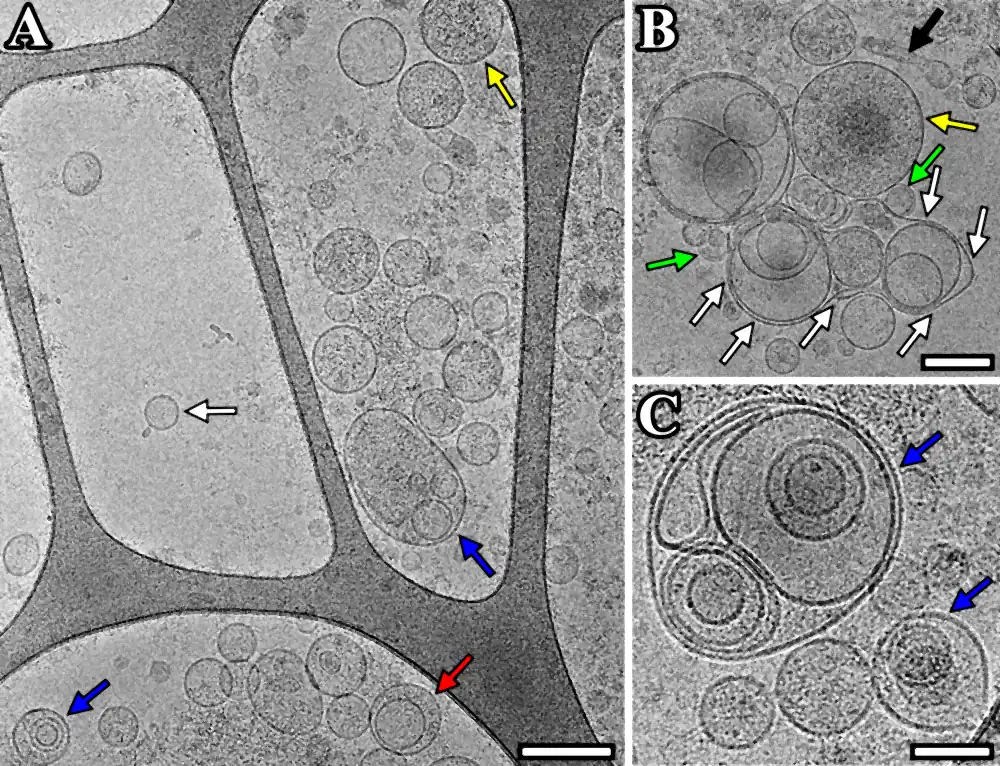
Emelyanov and colleagues applied the method to vesicles purified from human cerebrospinal fluid (Fig. 2). They recorded single, double, double-membrane and multilayer vesicles and vesicles with electron-dense cargo, and confirmed CD9 on the vesicle surface by flow cytometry.[10][11]
Their size and CD9 content indicated that most vesicles in the samples were exosome-like. Cryo-electron microscopy resolved what those bulk measurements average: lipid bilayers, internal structures and a wide spectrum of sizes and shapes.[10]
Negative-stain electron microscopy images dried vesicles
Negative-stain transmission electron microscopy dries vesicles on a grid and contrasts them with a heavy-metal stain. In the comparison by Nizamudeen and colleagues, negative-stain images of stem cell vesicles showed the familiar cup shape, and cryo-electron microscopy of the same preparation showed spherical and elongated vesicles with a clear membrane.[3]
Super-resolution microscopy localizes single molecules on individual vesicles
Small vesicles are below the diffraction limit of conventional light microscopy, which long made direct visualization of single vesicles difficult.[12] Direct stochastic optical reconstruction microscopy (dSTORM) records sparse, blinking fluorophores and computes the position of each one to build an image beyond that limit.[3]
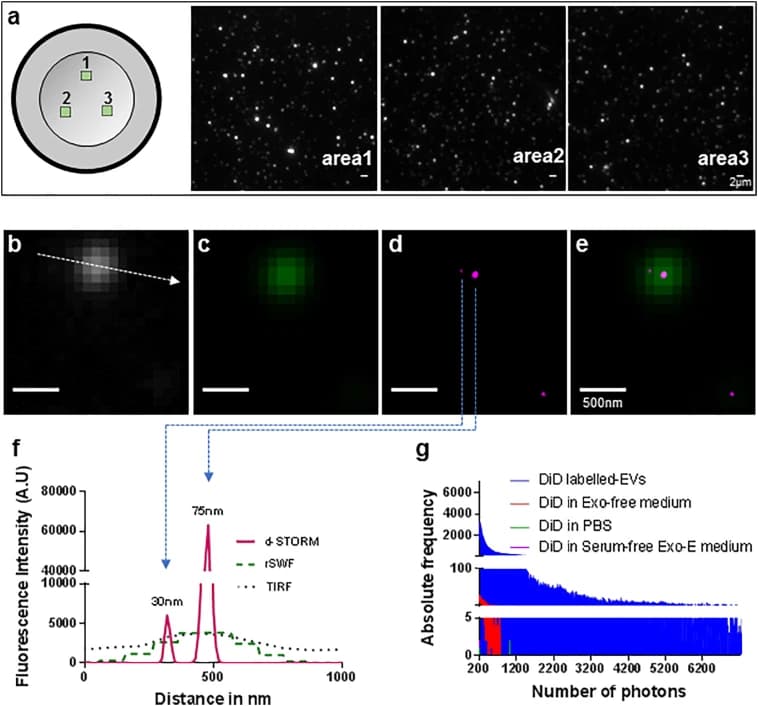
Nizamudeen and colleagues labeled vesicles from mesenchymal stem cells with a photo-switchable lipid dye and imaged them by dSTORM (Fig. 3). The method detected vesicles down to 20 to 30 nm, with higher sensitivity and lower variability than electron microscopy, nanoparticle tracking analysis or tunable resistive pulse sensing in their comparison.[3]
The same study derived vesicle counts from a standard curve of labeled vesicle dilutions and compared dSTORM size distributions with those from resistive pulse sensing and nanoparticle tracking. The authors also imaged labeled vesicles inside live neural stem cells in culture.[3]
McNamara and colleagues extended dSTORM to three dimensions. They localized clusters of the tetraspanins CD81 and CD9 on the surface of individual vesicles, evidence of membrane microdomains that they confirmed by cryo-electron microscopy.[12][13] Visualizing particles one by one showed the heterogeneity, structure and complexity of vesicles in new detail.[12]
Flow cytometry reads vesicles one at a time when sensitivity and calibration are defined
Flow cytometry measures light scatter and fluorescence on each particle as it crosses a laser. Most cytometers are designed for cells, so signals from vesicles partly overlap with background noise and make vesicles harder to detect.[14]
Swarm detection and the scatter limit
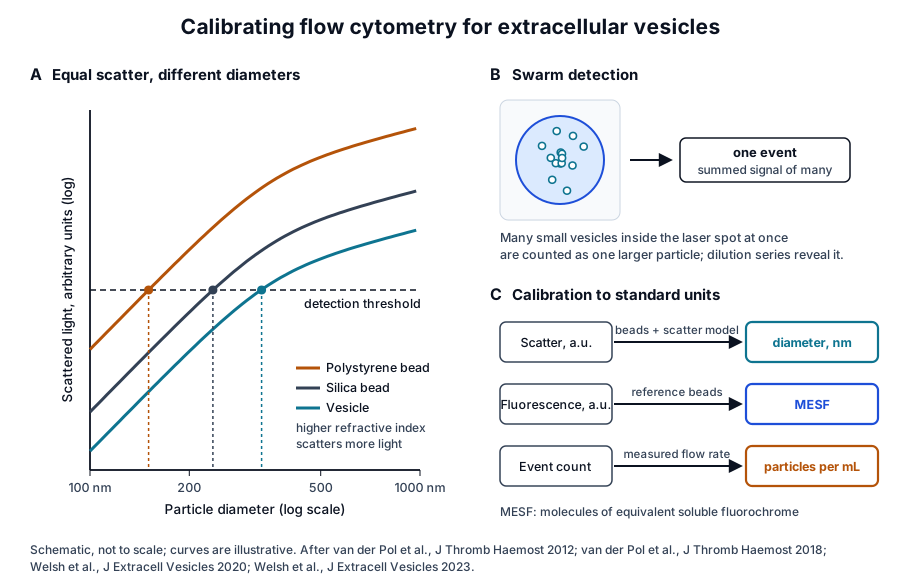
Van der Pol and colleagues related flow cytometry signals to vesicle diameter with bead measurements and Mie calculations of light scattering. At high concentrations, multiple vesicles smaller than 220 nm were counted as a single event, an effect they named swarm detection (Fig. 4).[15]
Arraud and colleagues counted plasma vesicles after sedimenting them directly onto electron microscopy grids and compared these counts with conventional flow cytometry on the same samples. The cytometer detected about 1 percent of the vesicles present.[7]
High-resolution and imaging flow cytometry
Van der Vlist and colleagues labeled vesicles brightly with a fluorescent dye and triggered detection on fluorescence in an optimized cytometer. The configuration detected vesicles of about 100 nm and reported their light scatter, quantity, buoyant density and surface proteins.[16]
Applied to dendritic cell vesicles, the method showed heterogeneity in buoyant density and MHC class II content. Stimulation of the cells and their contact with CD4 T cells changed both the number and the composition of the vesicles they released.[17]
Imaging flow cytometry records an image of each event. Görgens and colleagues used vesicles carrying CD63 fused to green fluorescent protein as a biological reference material, and optimized acquisition and analysis settings to detect single small vesicles.[18][19]
Tertel and colleagues then examined antibody staining on the same platform. Staining intensity and sample recovery varied with incubation temperature, and the differences narrowed with longer incubation.[20]
Calibration converts arbitrary units into diameter and concentration
Polystyrene beads have different optical properties from vesicles, so a gate set with beads corresponds to a different vesicle diameter.[15] Van der Pol and colleagues therefore combined calibration beads with a light scattering model to convert scatter into an estimated vesicle diameter.[21]
In their study of 46 flow cytometers across 33 participants, interlaboratory variability for the 1,200 to 3,000 nm diameter gate was 81 percent, compared with 139 percent with a bead gate. Measured flow rates differed sixfold between instruments set to the same nominal rate, so flow rate calibration proved essential.[21]
Sensitivity set what each instrument could report: 21 of the 46 cytometers detected the 600 to 1,200 nm diameter gate. Sensitivity also differed between optically similar instruments, which the authors linked to maintenance and training.[21]
Fluorescence is calibrated in the same way, with reference beads that express signal as molecules of equivalent soluble fluorochrome.[14] Calibrated units let laboratories compare the same vesicle population on different instruments.[22]
Interferometric imaging counts and phenotypes vesicles captured on a chip
Exosomes are small and have a low refractive index contrast, which makes them hard to characterize directly.[23] Single-particle interferometric reflectance imaging sensing (SP-IRIS) captures them on antibody spots on a microarray chip, and Daaboul and colleagues used it to count and phenotype individual vesicles larger than about 50 nm.[23]
They demonstrated the approach on vesicles purified from HEK 293 cells. From a very small volume of human cerebrospinal fluid, antibodies against tetraspanins captured particles of a size compatible with exosomes.[23]
Breitwieser and colleagues used SP-IRIS to compare the CD9, CD63 and CD81 phenotypes of small vesicles from different cell types. The tetraspanin combinations distinguished cell types, followed nonrandom patterns in some populations and shifted with culture conditions in vesicles from mesenchymal stem cells.[24]
Atomic force microscopy maps vesicle shape and mechanics on a surface
Atomic force microscopy scans a sharp tip across vesicles immobilized on a flat substrate and records their three-dimensional geometry. Skliar and Chernyshev described a workflow for imaging hydrated or dried vesicles on modified mica, and their sizes were consistent with cryo-electron microscopy.[5]
Dynamic sizing methods report a hydrodynamic diameter that includes the coronal layer of surface molecules, and for exosomes the difference from the vesicle size is significant.[5] Atomic force microscopy measures the geometry of each vesicle directly and can size large numbers of immobilized vesicles.[5]
Parisse and colleagues reviewed vesicles imaged on mica and glass. Isolation and deposition methods influenced the measured size distribution, morphology and mechanical properties, which makes the substrate and preparation part of every atomic force microscopy result.[25]
Raman spectroscopy reads the chemical composition of single vesicles
Raman spectroscopy reads a label-free chemical fingerprint from the light that molecules scatter. Tatischeff and colleagues combined Raman tweezers microspectroscopy with nanoparticle tracking and cryo-electron microscopy, and found at least two vesicle species of different chemical composition from Dictyostelium discoideum.[6]
Kruglik and colleagues trapped vesicles of about 100 nm from human urine and rat hepatocytes and recorded their spectra. They estimated protein, lipid, nucleic acid and carotenoid contributions and reported strong heterogeneity between individual trapped vesicles.[26]
The authors described Raman tweezers as a technique that reports the global biomolecular composition of a single vesicle or a small number of vesicles. They proposed it as a way to resolve vesicle subpopulations by chemistry.[26]
Reporting frameworks make single-vesicle data comparable
MIFlowCyt-EV defines what a flow cytometry study reports
Welsh and colleagues, a working group of ISEV, ISAC and ISTH, published MIFlowCyt-EV in 2020. The framework joins MISEV with the MIFlowCyt standard and covers sample staining, vesicle detection and measurement, and experimental design.[27]
MIFlowCyt-EV sets reporting content and leaves protocols open as instruments evolve.[27] A companion compendium explains the background, from light scattering and hardware to controls, calibration and data reporting,[14] and the ISTH introduced the framework to its community in 2022.[22]
- Instrument sensitivity and calibration, with scatter and fluorescence in standard units.[27]
- Assay controls, including dilution series that confirm single-particle detection.[14]
- Staining conditions, since incubation temperature alone changed antibody labeling in imaging flow cytometry.[20]
- Concentration with the measured flow rate and the diameter range it covers.[21]
Orthogonal platforms measure the same sample
Arab and colleagues measured vesicles from two human cell lines and synthetic particles on four platforms. Resistive pulse sensing and nanoflow cytometry returned similar counts, nanoparticle tracking returned about tenfold fewer vesicles, and sensitivity typically dropped off below 60 nm on the sizing platforms.[28]
With synthetic silica and polystyrene mixtures, SP-IRIS, resistive pulse sensing and nanoflow cytometry each resolved at least three of four size populations. Nanoparticle tracking reported a vesicle population with a mode diameter above 100 nm.[28]
SP-IRIS in fluorescence mode detected two tetraspanins on the same particle, and nanoflow cytometry detected CD81 or CD63.[28] MISEV2023 places single-particle approaches alongside bulk methods in its characterization guidance.[1]
Where to go from here
The particle counting reference compares nanoparticle tracking analysis with microfluidic resistive pulse sensing, and the marker panel reference explains how the share of vesicles carrying CD9, CD63 and CD81 is measured. The protein marker and isolation pages in this cluster describe the biology and preparation behind those numbers.
The MISEV2023 reference sets out what a vesicle characterization report contains. Verified practices can request lot documentation, and our team is glad to discuss the methods described on this page.
Annotated References
Numbered in the order they are cited in the text. Each source is annotated with what it supports on this page; peer-reviewed articles are listed with journal, volume, issue and pages, and primary sources are regulations, agency documents and reference databases.
- 1.Peer-reviewedWelsh JA, Goberdhan DCI, O'Driscoll L, et al. Minimal information for studies of extracellular vesicles (MISEV2023): From basic to advanced approaches. Journal of Extracellular Vesicles. 2024;13(2):e12404. https://pubmed.ncbi.nlm.nih.gov/38326288/Annotation: ISEV guidance on vesicle production, separation and characterization. Cited for its summary of characterization approaches, including single-particle methods, with their advantages and limitations.
- 2.Peer-reviewedZabeo D, Cvjetkovic A, Lässer C, et al. Exosomes purified from a single cell type have diverse morphology. Journal of Extracellular Vesicles. 2017;6(1):1329476. https://pubmed.ncbi.nlm.nih.gov/28717422/Annotation: Electron microscopy of exosomes from the HMC-1 mast cell line. Cited for the nine morphological categories and the need to define exosome subpopulations more precisely.
- 3.Peer-reviewedNizamudeen Z, Markus R, Lodge R, et al. Rapid and accurate analysis of stem cell-derived extracellular vesicles with super resolution microscopy and live imaging. Biochimica et Biophysica Acta. Molecular Cell Research. 2018;1865(12):1891-1900. https://pubmed.ncbi.nlm.nih.gov/30290236/Annotation: dSTORM imaging of vesicles from mesenchymal stem cells compared with electron microscopy, nanoparticle tracking and resistive pulse sensing. Cited for detection down to 20 to 30 nm and the negative-stain and cryo-EM morphologies; source of Fig. 3.
- 4.Peer-reviewedvan der Pol E, Coumans FA, Grootemaat AE, et al. Particle size distribution of exosomes and microvesicles determined by transmission electron microscopy, flow cytometry, nanoparticle tracking analysis, and resistive pulse sensing. Journal of Thrombosis and Haemostasis. 2014;12(7):1182-1192. https://pubmed.ncbi.nlm.nih.gov/24818656/Annotation: Comparison of five techniques on one vesicle sample. Cited for the minimum detectable diameter of about 270 to 600 nm for conventional flow cytometry.
- 5.Peer-reviewedSkliar M, Chernyshev VS. Imaging of Extracellular Vesicles by Atomic Force Microscopy. Journal of Visualized Experiments. 2019. https://pubmed.ncbi.nlm.nih.gov/31566613/Annotation: Atomic force microscopy workflow for vesicles on modified mica. Cited for cryo-TEM as the reference sizing technique and for atomic force microscopy sizes consistent with it.
- 6.Peer-reviewedTatischeff I, Larquet E, Falcón-Pérez JM, et al. Fast characterisation of cell-derived extracellular vesicles by nanoparticles tracking analysis, cryo-electron microscopy, and Raman tweezers microspectroscopy. Journal of Extracellular Vesicles. 2012;1:19179. https://pubmed.ncbi.nlm.nih.gov/24009887/Annotation: Combined nanoparticle tracking, cryo-electron microscopy and Raman tweezers on Dictyostelium vesicles. Cited for cryo-EM as a morphology method and for two chemically distinct vesicle species.
- 7.Peer-reviewedArraud N, Linares R, Tan S, et al. Extracellular vesicles from blood plasma: determination of their morphology, size, phenotype and concentration. Journal of Thrombosis and Haemostasis. 2014;12(5):614-627. https://pubmed.ncbi.nlm.nih.gov/24618123/Annotation: Cryo-electron microscopy with gold labeling of plasma vesicles from healthy donors. Cited for vesicle sizes and shapes, the minority exposing phosphatidylserine, and conventional flow cytometry detecting about 1 percent of vesicles.
- 8.Peer-reviewedBrisson AR, Tan S, Linares R, et al. Extracellular vesicles from activated platelets: a semiquantitative cryo-electron microscopy and immuno-gold labeling study. Platelets. 2017;28(3):263-271. https://pubmed.ncbi.nlm.nih.gov/28102751/Annotation: Semiquantitative cryo-electron microscopy of platelet vesicles. Cited for the 50 to 400 nm size range of about half the vesicles and the two CD63-positive populations.
- 9.Peer-reviewedHöög JL, Lötvall J. Diversity of extracellular vesicles in human ejaculates revealed by cryo-electron microscopy. Journal of Extracellular Vesicles. 2015;4:28680. https://pubmed.ncbi.nlm.nih.gov/26563734/Annotation: Cryo-electron microscopy and tomography of unprocessed human ejaculate. Cited for imaging without centrifugation, fixation or stain, and the inventory of about 1,500 structures in vesicle and membrane subcategories.
- 10.Peer-reviewedEmelyanov A, Shtam T, Kamyshinsky R, et al. Cryo-electron microscopy of extracellular vesicles from cerebrospinal fluid. PLoS One. 2020;15(1):e0227949. https://pubmed.ncbi.nlm.nih.gov/31999742/Annotation: Cryo-electron microscopy, nanoparticle tracking and flow cytometry of vesicles from human cerebrospinal fluid. Cited for the morphological classes observed and CD9 on the vesicle surface; source of Fig. 2.
- 11.DatabaseNCBI Gene 928, CD9 molecule (Homo sapiens). Accessed 20 October 2026. https://www.ncbi.nlm.nih.gov/gene/928
- 12.Peer-reviewedMcNamara RP, Zhou Y, Eason AB, et al. Imaging of surface microdomains on individual extracellular vesicles in 3-D. Journal of Extracellular Vesicles. 2022;11(3):e12191. https://pubmed.ncbi.nlm.nih.gov/35234354/Annotation: Three-dimensional dSTORM of single vesicles confirmed by cryo-EM. Cited for the diffraction limit and for CD81 and CD9 clusters forming surface microdomains.
- 13.DatabaseNCBI Gene 975, CD81 molecule (Homo sapiens). Accessed 20 October 2026. https://www.ncbi.nlm.nih.gov/gene/975
- 14.Peer-reviewedWelsh JA, Arkesteijn GJA, Bremer M, et al. A compendium of single extracellular vesicle flow cytometry. Journal of Extracellular Vesicles. 2023;12(2):e12299. https://pubmed.ncbi.nlm.nih.gov/36759917/Annotation: Background compendium from the ISEV, ISAC and ISTH working group. Cited for vesicle signals overlapping background noise, assay controls and fluorescence calibration.
- 15.Peer-reviewedvan der Pol E, van Gemert MJ, Sturk A, et al. Single vs. swarm detection of microparticles and exosomes by flow cytometry. Journal of Thrombosis and Haemostasis. 2012;10(5):919-930. https://pubmed.ncbi.nlm.nih.gov/22394434/Annotation: Bead measurements and Mie modeling of vesicle light scattering. Cited for swarm detection of vesicles smaller than 220 nm and the optical difference between beads and vesicles.
- 16.Peer-reviewedvan der Vlist EJ, Nolte-'t Hoen EN, Stoorvogel W, et al. Fluorescent labeling of nano-sized vesicles released by cells and subsequent quantitative and qualitative analysis by high-resolution flow cytometry. Nature Protocols. 2012;7(7):1311-1326. https://pubmed.ncbi.nlm.nih.gov/22722367/Annotation: Method description for fluorescence-triggered high-resolution flow cytometry. Cited for detection of vesicles of about 100 nm with scatter, quantity, density and surface protein readouts.
- 17.Peer-reviewedNolte-'t Hoen EN, van der Vlist EJ, de Boer-Brouwer M, et al. Dynamics of dendritic cell-derived vesicles: high-resolution flow cytometric analysis of extracellular vesicle quantity and quality. Journal of Leukocyte Biology. 2013;93(3):395-402. https://pubmed.ncbi.nlm.nih.gov/23248328/Annotation: High-resolution flow cytometry of dendritic cell vesicles. Cited for heterogeneity in density and MHC class II content and for changes in vesicle number and composition with cell stimulation.
- 18.Peer-reviewedGörgens A, Bremer M, Ferrer-Tur R, et al. Optimisation of imaging flow cytometry for the analysis of single extracellular vesicles by using fluorescence-tagged vesicles as biological reference material. Journal of Extracellular Vesicles. 2019;8(1):1587567. https://pubmed.ncbi.nlm.nih.gov/30949308/Annotation: Optimization of imaging flow cytometry with CD63-eGFP vesicles as reference material. Cited for single small-vesicle detection and the 300 nm floor of most conventional cytometers.
- 19.DatabaseNCBI Gene 967, CD63 molecule (Homo sapiens). Accessed 20 October 2026. https://www.ncbi.nlm.nih.gov/gene/967
- 20.Peer-reviewedTertel T, Bremer M, Maire C, et al. High-Resolution Imaging Flow Cytometry Reveals Impact of Incubation Temperature on Labeling of Extracellular Vesicles with Antibodies. Cytometry Part A. 2020;97(6):602-609. https://pubmed.ncbi.nlm.nih.gov/32415810/Annotation: Systematic evaluation of antibody staining temperature in imaging flow cytometry. Cited for the effect of incubation temperature on staining intensity and sample recovery.
- 21.Peer-reviewedvan der Pol E, Sturk A, van Leeuwen T, et al. Standardization of extracellular vesicle measurements by flow cytometry through vesicle diameter approximation. Journal of Thrombosis and Haemostasis. 2018;16(6):1236-1245. https://pubmed.ncbi.nlm.nih.gov/29575716/Annotation: Multicenter comparison of 46 flow cytometers with diameter-based gates. Cited for the 81 versus 139 percent interlaboratory variability, the sixfold flow rate differences and instrument detection limits.
- 22.Peer-reviewedvan der Pol E, Welsh JA, Nieuwland R. Minimum information to report about a flow cytometry experiment on extracellular vesicles: Communication from the ISTH SSC subcommittee on vascular biology. Journal of Thrombosis and Haemostasis. 2022;20(1):245-251. https://pubmed.ncbi.nlm.nih.gov/34637195/Annotation: ISTH communication introducing MIFlowCyt-EV. Cited for its introduction to the ISTH community and the role of calibration in reproducible vesicle flow cytometry.
- 23.Peer-reviewedDaaboul GG, Gagni P, Benussi L, et al. Digital Detection of Exosomes by Interferometric Imaging. Scientific Reports. 2016;6:37246. https://pubmed.ncbi.nlm.nih.gov/27853258/Annotation: Description of SP-IRIS for vesicles on antibody microarray chips. Cited for digital counting and multiplexed phenotyping above about 50 nm and tetraspanin capture from cerebrospinal fluid.
- 24.Peer-reviewedBreitwieser K, Koch LF, Tertel T, et al. Detailed Characterization of Small Extracellular Vesicles from Different Cell Types Based on Tetraspanin Composition by ExoView R100 Platform. International Journal of Molecular Sciences. 2022;23(15):8544. https://pubmed.ncbi.nlm.nih.gov/35955677/Annotation: Single-vesicle SP-IRIS phenotyping of CD9, CD63 and CD81 across cell types. Cited for cell-type-specific tetraspanin signatures and their shift with culture conditions.
- 25.Peer-reviewedParisse P, Rago I, Ulloa Severino L, et al. Atomic force microscopy analysis of extracellular vesicles. European Biophysics Journal. 2017;46(8):813-820. https://pubmed.ncbi.nlm.nih.gov/28866771/Annotation: Review of atomic force microscopy of vesicles on mica and glass. Cited for the influence of isolation and deposition on measured size, morphology and mechanical properties.
- 26.Peer-reviewedKruglik SG, Royo F, Guigner JM, et al. Raman tweezers microspectroscopy of circa 100 nm extracellular vesicles. Nanoscale. 2019;11(4):1661-1679. https://pubmed.ncbi.nlm.nih.gov/30620023/Annotation: Raman tweezers spectra of single or few trapped vesicles from urine and hepatocytes. Cited for biomolecular component estimates and heterogeneity between individual vesicles.
- 27.Peer-reviewedWelsh JA, Van Der Pol E, Arkesteijn GJA, et al. MIFlowCyt-EV: a framework for standardized reporting of extracellular vesicle flow cytometry experiments. Journal of Extracellular Vesicles. 2020;9(1):1713526. https://pubmed.ncbi.nlm.nih.gov/32128070/Annotation: Consensus reporting framework from the ISEV, ISAC and ISTH working group. Cited for the content of MIFlowCyt-EV and its emphasis on calibration and standardization.
- 28.Peer-reviewedArab T, Mallick ER, Huang Y, et al. Characterization of extracellular vesicles and synthetic nanoparticles with four orthogonal single-particle analysis platforms. Journal of Extracellular Vesicles. 2021;10(6):e12079. https://pubmed.ncbi.nlm.nih.gov/33850608/Annotation: Comparison of SP-IRIS, nanoparticle tracking, resistive pulse sensing and nanoflow cytometry on the same samples. Cited for relative counts, the 60 nm sensitivity edge and two-marker detection by SP-IRIS.
Cite this page
ExaVeyra Sciences Editorial Team. Single-Vesicle Analysis: Cryo-EM, Super-Resolution and Flow. ExaVeyra Sciences; 20 October 2026. Available from: https://exaveyra.com/science/exosome-biochemistry/single-vesicle-analysis-imaging. Accessed [date accessed].