Esta referencia está disponible actualmente en inglés. La versión en español está en preparación.
Risk of Bias Assessment: RoB 2 and ROBINS-I
Por Benn Bluestein-Veyra, M.Sc. en Química Orgánica · Actualizado el 21 de octubre de 2026
ExaVeyra Sciences es un proveedor B2B con sede en Miami que suministra exosomas para uso estético tópico a clínicas con licencia, y remite a los prescriptores con licencia a una farmacia de preparados compuestos 503A que prepara formulaciones según prescripciones individuales.
| Pregunta | Respuesta |
|---|---|
| Qué cubre esta página | How reviewers judge trial and observational study quality with the Cochrane RoB 2 and ROBINS-I tools, domain by domain. |
| Quién puede hacer pedidos | Clínicas y profesionales con licencia profesional activa y NPI verificados por ExaVeyra. Los pedidos de exosomas requieren además un reconocimiento firmado de uso profesional. |
| Qué se envía y cómo | El material de exosomas para uso estético tópico, caracterizado por lote, se envía en cadena de frío por exprés nocturno. La entrega puede tardar 1 a 3 días hábiles. Se emite un certificado de análisis para cada lote y se entrega a solicitud. |
A risk of bias assessment judges whether flaws in the design, conduct, analysis or reporting of a study could push its result above or below the true effect. Cochrane's RoB 2 tool covers randomized trials and ROBINS-I covers non-randomized studies of interventions, and both work domain by domain.[1][2][3]
Systematic reviewers assess each included study before they pool results, and the judgments then shape the GRADE rating of certainty for the body of evidence. This reference covers the tools, their signaling questions, the plots that display them and the empirical studies behind them.[4][5]
Distinguishing risk of bias from imprecision and reporting quality
Higgins and colleagues define internal validity as the extent to which a study is free from bias, a systematic error. They separate it from precision, the freedom from random error, which depends on the number of participants and events.[1]
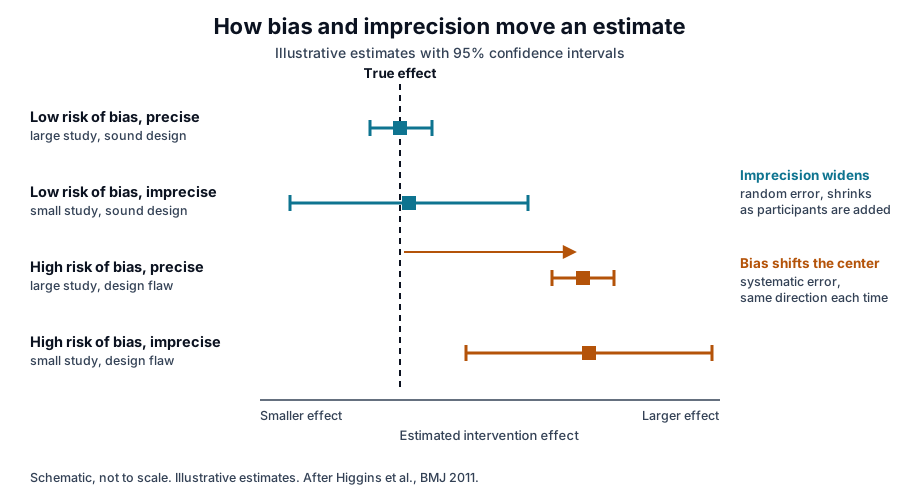
A small trial at low risk of bias can give an imprecise result with a wide confidence interval, and a large trial can give a precise result that is still biased (Fig. 1).[1] Adding participants narrows the interval, while the design and conduct of the study set where the estimate is centered.[1]
Reporting quality describes how completely a paper documents its methods. The CONSORT 2025 statement sets a 30-item checklist and a participant flow diagram for reports of randomized trials, so readers can see how a trial was run.[6]
A sound study can be reported sparsely, which leaves assessors without the facts a judgment needs. Lo and colleagues found low agreement between reviewers' and study authors' Newcastle-Ottawa assessments, and suggested asking authors for methodological details missing from publications.[7]
Quality scales blend these properties into one number. Higgins and colleagues set scales aside because they combine reporting with conduct and weight items in ways that are hard to justify, and their associations with effect estimates have been inconsistent.[1] Moher and colleagues found that the way quality scores entered a meta-analysis changed the interpretation of the pooled benefit.[8]
Understanding the original Cochrane tool and why it was revised
The Cochrane Collaboration published its tool for assessing risk of bias in randomized trials in 2011, noting that flaws in design, conduct, analysis and reporting can make an intervention effect look larger or smaller than it is.[1] The tool covered six domains: selection, performance, detection, attrition and reporting bias, plus other bias.[1]
Each item had two parts. A support for judgment described the relevant trial feature, ideally with verbatim quotes, and a judgment rated the item at low, high or unclear risk of bias.[1] Assessments were made for each main outcome or class of outcomes.[1]
Sterne and colleagues released RoB 2 in 2019 to reflect how understanding of the causes of bias had advanced.[2] The main changes from the first version are these:
- Each assessment targets a single numerical result from a trial, and a trial contributing several results may need several assessments.[2]
- Domain names describe the issue they address, replacing labels such as selection bias and performance bias.[2]
- Signaling questions and algorithms guide each domain judgment.[2]
- The tool separates the effect of assignment to an intervention from the effect of adhering to it.[2]
- The domain set is fixed, and an explicit process yields the overall judgment for the result.[2]
Applying RoB 2 domain by domain to a randomized trial
RoB 2 has five domains, each tied to a stage of the trial where bias can enter a result (Fig. 2).[2] The issues each domain addresses are summarized below.
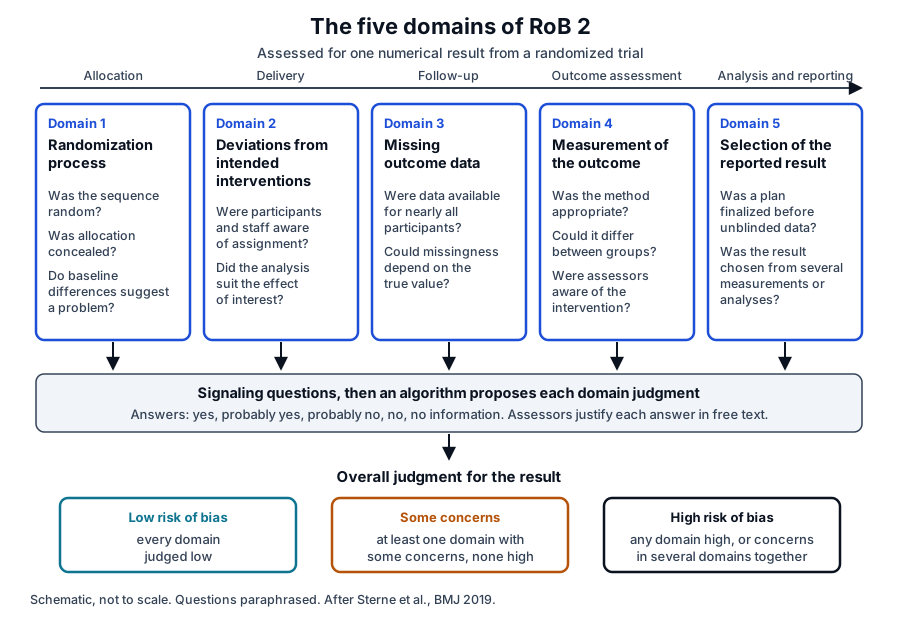
- Bias arising from the randomization process: whether the allocation sequence was random and concealed, and whether baseline differences between groups suggest a problem.[2]
- Bias due to deviations from intended interventions: whether participants and the people delivering interventions knew the assignment, and whether the analysis suited the effect of interest.[2]
- Bias due to missing outcome data: whether data were available for nearly all randomized participants, and whether missingness could depend on the true value of the outcome.[2]
- Bias in measurement of the outcome: whether the method was appropriate, whether it could differ between groups, and whether assessors knew the intervention received.[2]
- Bias in selection of the reported result: whether the analysis followed a plan finalized before unblinded outcome data were available, and whether the result was chosen from several measurements or analyses.[2]
Signaling questions lead to a proposed judgment
Each domain opens with signaling questions answered yes, probably yes, probably no, no or no information. Yes and probably yes carry the same implication for bias, as do no and probably no.[2]
An algorithm maps the answers to a proposed domain judgment of low risk of bias, some concerns or high risk of bias. Assessors justify each answer in free text, may override the proposal with a reason, and can record the likely direction of bias.[2]
| Overall RoB 2 judgment | Pattern across the five domains |
|---|---|
| Low risk of bias | Every domain is judged at low risk for this result |
| Some concerns | At least one domain raises some concerns, and no domain is high |
| High risk of bias | At least one domain is high, or several domains raise some concerns that together substantially lower confidence in the result |
The overall judgment for a result therefore matches the least favorable domain, with room to move to high when several domains raise some concerns together.[2]
The effect of interest shapes the deviations domain
For the effect of assignment, often called the intention-to-treat effect, assessors ask whether deviations arose from the trial context and whether an appropriate analysis estimated that effect. For the effect of adhering, they ask about non-protocol interventions, implementation failures and adherence.[2]
Regulators frame the same choice through estimands. The FDA guidance E9(R1), issued in May 2021, presents a structured framework for agreeing on the effect a clinical trial sets out to estimate.[9]
Calibration supports consistent judgments
Minozzi and colleagues had four raters apply RoB 2 to 70 trial results. Agreement was moderate for the randomization domain and slight for the overall judgment, and the tool took a mean of 28 minutes per outcome.[10]
The authors described RoB 2 as detailed, comprehensive and demanding to apply, even for raters with substantial expertise in systematic reviews, and recommended calibration exercises and intensive training before its application to improve reliability.[10]
Assessing non-randomized studies with ROBINS-I
ROBINS-I, published by Sterne and colleagues in 2016, assesses risk of bias in estimates of comparative effectiveness from studies that did not use randomization to allocate individuals or clusters.[3] It reads each study as an attempt to emulate a target trial, a hypothetical pragmatic randomized trial in the same participant group with no features putting it at risk of bias.[3]
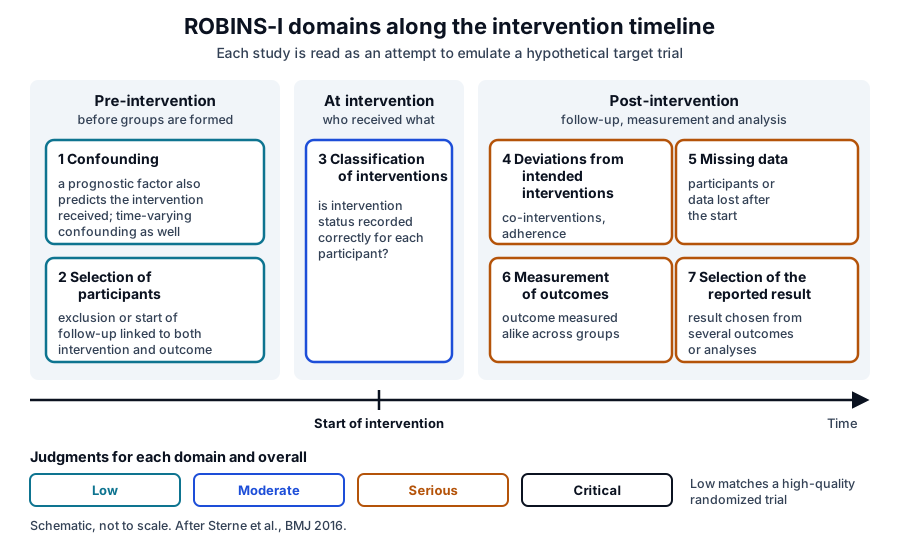
Its seven domains follow the timeline of the intervention (Fig. 3). Two address issues before the intervention starts, one addresses classification of the interventions themselves, and four address issues after the start.[3]
- Confounding: a prognostic variable that predicts the outcome also predicts the intervention received at baseline.[3]
- Selection of participants into the study: exclusion of eligible participants, or their start of follow-up, is related to both intervention and outcome.[3]
- Classification of interventions: intervention status is recorded with error.[3]
- Deviations from intended interventions, missing data, measurement of outcomes and selection of the reported result, which parallel the RoB 2 domains.[3]
Signaling questions take the same five responses as RoB 2, and judgments run from low to moderate, serious and critical risk of bias. Low risk corresponds to the risk of bias in a high-quality randomized trial, and the authors expect a non-randomized study to reach low risk for confounding only exceptionally.[3]
ROBINS-I also addresses time-varying confounding, which arises when participants switch between the interventions being compared or when prognostic factors after baseline affect the intervention received.[3]
ROBINS-E extends the approach to exposures
Higgins and colleagues published ROBINS-E in 2024 for cohort studies of the causal effect of an exposure on an outcome, such as environmental, occupational or behavioral exposures. It also works through seven domains of signaling questions toward an overall judgment and a predicted direction of bias.[11]
Matching the risk of bias tool to the study design
Diagnostic accuracy studies, animal experiments and observational cohorts each have a dedicated tool built on the same domain logic.[7][12][13] The table pairs each tool with its design.
| Tool | Study design | Structure | Judgments |
|---|---|---|---|
| RoB 2 (2019) | Randomized trials | Five fixed domains with signaling questions | Low, some concerns, high |
| ROBINS-I (2016) | Non-randomized studies of interventions | Seven domains around a target trial | Low, moderate, serious, critical |
| ROBINS-E (2024) | Cohort studies of exposures | Seven domains with signaling questions | Domain and overall judgments, with direction |
| QUADAS-2 (2011) | Diagnostic accuracy studies | Four domains, three also rated for applicability | Risk of bias and applicability |
| SYRCLE (2014) | Animal intervention studies | Ten entries adapted from the Cochrane tool | Signaling questions guide each entry |
| Newcastle-Ottawa scale | Cohort and case-control studies | Three domains | Up to nine points |
Whiting and colleagues developed QUADAS-2 for diagnostic accuracy studies. Its four domains cover how participants were selected, the index test, the reference standard, and flow and timing, and the first three also receive judgments of applicability.[12]
Hooijmans and colleagues adapted the Cochrane tool for animal intervention studies as SYRCLE's risk of bias tool. Its 10 entries cover selection, performance, detection, attrition, reporting and other biases, and half of them match items in the Cochrane tool.[13]
The Newcastle-Ottawa scale awards cohort and case-control studies up to nine points across selection of study groups, comparability of groups and ascertainment of exposure or outcome. Lo and colleagues found slight to poor agreement on its items between reviewers and study authors.[7]
Presenting judgments in traffic-light and summary plots
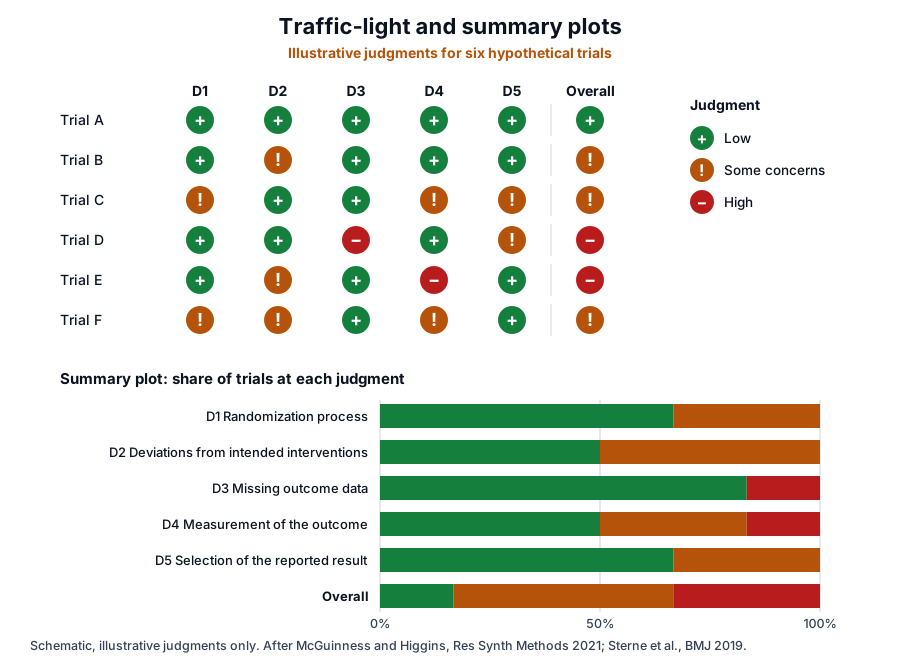
The same judgments can be shown two ways: a grid with one row per study and one colored cell per domain, and a bar summary of the share of studies at each judgment in every domain (Fig. 4). McGuinness and Higgins built robvis, an R package and Shiny web app that turns an assessment table into publication-quality risk of bias figures.[14]
The PRISMA 2020 statement guides how systematic reviews report the way they identify, select, appraise and synthesize studies, through a 27-item checklist and revised flow diagrams. Risk of bias methods and results belong to that appraisal step.[5]
A plot summarizes, and the written support behind each judgment carries the reasoning. RoB 2 asks for free-text justification of every answer and judgment, so readers can trace how each rating was reached.[2]
Meta-epidemiological studies show design features shifting effect estimates
Meta-epidemiology compares trials with and without a design feature across many meta-analyses, often as a ratio of odds ratios. In the analysis by Wood and colleagues, a ratio below 1 means that trials lacking the feature reported larger intervention effects.[15]
Schulz and colleagues assessed 250 controlled trials from 33 meta-analyses in 1995. Odds ratios were exaggerated by 41% in trials with inadequate allocation concealment and by 17% in trials without double blinding.[16]
Wood and colleagues combined 146 meta-analyses including 1,346 trials. For subjective outcomes, estimates were exaggerated when allocation concealment was inadequate or unclear or blinding was absent, with little evidence of bias for objective outcomes.[15]
Savović and colleagues pooled 1,973 trials and estimated that lack of double blinding exaggerated intervention effects by an average of 13%, driven mainly by trials with subjectively assessed outcomes.[17] The ROBES study of 2,443 trials in Cochrane reviews found exaggerated estimates in trials at high or unclear risk for sequence generation, allocation concealment and blinding.[18]
Page and colleagues reviewed 24 meta-epidemiological studies and reported exaggerated estimates with inadequate or unclear sequence generation and allocation concealment, with the average bias largest for subjective outcomes.[19]
Measurement and reporting carry the same pattern
Hróbjartsson and colleagues studied trials that assessed the same binary outcome with both blinded and non-blinded assessors. Non-blinded assessment exaggerated odds ratios by 36% on average, driven by the misclassification of a median 3% of assessed participants.[20]
Chan and colleagues compared trial protocols with their publications and found that 62% of trials had at least one primary outcome changed, introduced or omitted.[21] Kirkham and colleagues found that a third of Cochrane reviews contained at least one trial with high suspicion of outcome reporting bias for the review's primary outcome.[22]
Registered outcomes give assessors a fixed point of comparison for the reported result domain. For applicable clinical trials, 42 CFR Part 11 requires a ClinicalTrials.gov registration to describe each primary outcome measure with its metric and the time points at which it is assessed.[23]
Carrying risk of bias assessment into GRADE certainty
GRADE rates certainty for a body of evidence at four levels: high, moderate, low and very low. Randomized trials start high and observational studies start low, and risk of bias sits beside imprecision, inconsistency, indirectness and publication bias as reasons to rate down.[24]
Guyatt and colleagues advise rating down when most of the relevant evidence comes from studies at high risk of bias. Reviewers judge each outcome separately, avoid averaging across studies, and may restrict an analysis to the studies at lower risk of bias.[4]
Wood and colleagues recommended that reviewers report meta-analyses restricted to trials at low risk of bias, either as the primary analysis or alongside the analysis of all trials.[15]
Schünemann and colleagues describe how ROBINS-I places randomized and non-randomized studies on a common metric for risk of bias within GRADE. Large effects, dose-effect relations and plausible residual confounding that would strengthen the conclusion can then raise certainty.[25]
Where to go from here
The hierarchy of evidence reference places these tools within the full range of study designs, and the randomized controlled trials reference explains the allocation and blinding methods that RoB 2 examines. The sham and placebo controls reference covers the comparators that make blinding possible.
The systematic reviews and meta-analysis reference shows how these judgments feed a pooled estimate, and the clinical trial phases reference follows research from IND to FDA approval. The guide to reading the evidence and the exosome clinical trials reference apply these ideas, and our team is glad to talk through any study you are reading.
Referencias comentadas
Numeradas en el orden en que se citan en el texto. Cada fuente lleva una nota sobre lo que respalda en esta página; los artículos revisados por pares se listan con revista, volumen, número y páginas, y las fuentes primarias son regulaciones, documentos de agencias y bases de datos de referencia.
- 1.Peer-reviewedHiggins JP, Altman DG, Gøtzsche PC, et al. The Cochrane Collaboration's tool for assessing risk of bias in randomised trials. BMJ. 2011. https://pubmed.ncbi.nlm.nih.gov/22008217/Annotation: The original Cochrane risk of bias tool. Cited for internal validity versus precision, the six domains, support for judgment with low, high or unclear ratings, and the case against quality scales.
- 2.Peer-reviewedSterne JAC, Savović J, Page MJ, et al. RoB 2: a revised tool for assessing risk of bias in randomised trials. BMJ. 2019. https://pubmed.ncbi.nlm.nih.gov/31462531/Annotation: The revised Cochrane tool for randomized trials. Cited for its five domains, signaling questions, algorithms, the assignment and adhering effects, and the overall judgment rules.
- 3.Peer-reviewedSterne JA, Hernán MA, Reeves BC, et al. ROBINS-I: a tool for assessing risk of bias in non-randomised studies of interventions. BMJ. 2016. https://pubmed.ncbi.nlm.nih.gov/27733354/Annotation: The ROBINS-I tool. Cited for the target trial, the seven domains before, at and after the start of intervention, time-varying confounding, and the low to critical judgment scale.
- 4.Peer-reviewedGuyatt GH, Oxman AD, Vist G, et al. GRADE guidelines: 4. Rating the quality of evidence--study limitations (risk of bias). Journal of Clinical Epidemiology. 2011. https://pubmed.ncbi.nlm.nih.gov/21247734/Annotation: GRADE guidance on study limitations. Cited for rating down when most evidence is at high risk of bias, judging by outcome, avoiding averages and restricting to lower-risk studies.
- 5.Peer-reviewedPage MJ, McKenzie JE, Bossuyt PM, et al. The PRISMA 2020 statement: an updated guideline for reporting systematic reviews. BMJ. 2021;372:n71. https://pubmed.ncbi.nlm.nih.gov/33782057/Annotation: The current reporting guideline for systematic reviews. Cited for its 27-item checklist covering how studies are identified, selected, appraised and synthesized.
- 6.Peer-reviewedHopewell S, Chan AW, Collins GS, et al. CONSORT 2025 statement: updated guideline for reporting randomised trials. BMJ. 2025. https://pubmed.ncbi.nlm.nih.gov/40228833/Annotation: The current reporting guideline for randomized trials. Cited for the 30-item checklist and participant flow diagram that document how a trial was run.
- 7.Peer-reviewedLo CK, Mertz D, Loeb M. Newcastle-Ottawa Scale: comparing reviewers' to authors' assessments. BMC Medical Research Methodology. 2014. https://pubmed.ncbi.nlm.nih.gov/24690082/Annotation: Methods study comparing reviewer and author ratings of 65 cohort studies. Cited for the nine-point, three-domain structure of the scale and the low agreement between raters.
- 8.Peer-reviewedMoher D, Pham B, Jones A, et al. Does quality of reports of randomised trials affect estimates of intervention efficacy reported in meta-analyses? Lancet. 1998. https://pubmed.ncbi.nlm.nih.gov/9746022/Annotation: Replication of 11 meta-analyses with quality scores applied in different ways. Cited for the finding that incorporating quality scores changed the interpretation of the pooled estimate.
- 9.RegulatoryFDA, E9(R1) Statistical Principles for Clinical Trials: Addendum: Estimands and Sensitivity Analysis in Clinical Trials, Guidance for Industry (May 2021). Accessed 20 October 2026. https://www.fda.gov/regulatory-information/search-fda-guidance-documents/e9r1-statistical-principles-clinical-trials-addendum-estimands-and-sensitivity-analysis-clinical
- 10.Peer-reviewedMinozzi S, Cinquini M, Gianola S, et al. The revised Cochrane risk of bias tool for randomized trials (RoB 2) showed low interrater reliability and challenges in its application. Journal of Clinical Epidemiology. 2020. https://pubmed.ncbi.nlm.nih.gov/32562833/Annotation: Cross-sectional methods study of four raters applying RoB 2 to 70 trial results. Cited for agreement by domain, time per outcome and the call for calibration and training.
- 11.Peer-reviewedHiggins JPT, Morgan RL, Rooney AA, et al. A tool to assess risk of bias in non-randomized follow-up studies of exposure effects (ROBINS-E). Environment International. 2024. https://pubmed.ncbi.nlm.nih.gov/38555664/Annotation: The ROBINS-E tool for cohort studies of exposures. Cited for its seven domains, signaling questions, overall judgment and predicted direction of bias.
- 12.Peer-reviewedWhiting PF, Rutjes AW, Westwood ME, et al. QUADAS-2: a revised tool for the quality assessment of diagnostic accuracy studies. Annals of Internal Medicine. 2011. https://pubmed.ncbi.nlm.nih.gov/22007046/Annotation: The QUADAS-2 tool for diagnostic accuracy studies. Cited for its four domains and the applicability judgments on the first three.
- 13.Peer-reviewedHooijmans CR, Rovers MM, de Vries RB, et al. SYRCLE's risk of bias tool for animal studies. BMC Medical Research Methodology. 2014. https://pubmed.ncbi.nlm.nih.gov/24667063/Annotation: Adaptation of the Cochrane tool for animal intervention studies. Cited for its ten entries across six bias types and the half that match the Cochrane items.
- 14.Peer-reviewedMcGuinness LA, Higgins JPT. Risk-of-bias VISualization (robvis): An R package and Shiny web app for visualizing risk-of-bias assessments. Research Synthesis Methods. 2021. https://pubmed.ncbi.nlm.nih.gov/32336025/Annotation: Software paper describing robvis. Cited for the R package and Shiny web app that produce publication-quality risk of bias figures.
- 15.Peer-reviewedWood L, Egger M, Gluud LL, et al. Empirical evidence of bias in treatment effect estimates in controlled trials with different interventions and outcomes: meta-epidemiological study. BMJ. 2008. https://pubmed.ncbi.nlm.nih.gov/18316340/Annotation: Combined analysis of 146 meta-analyses and 1,346 trials. Cited for the ratio of odds ratios, bias concentrated in subjective outcomes, and restricted analyses of low-risk trials.
- 16.Peer-reviewedSchulz KF, Chalmers I, Hayes RJ, et al. Empirical evidence of bias. Dimensions of methodological quality associated with estimates of treatment effects in controlled trials. JAMA. 1995. https://pubmed.ncbi.nlm.nih.gov/7823387/Annotation: Early meta-epidemiological study of 250 trials from 33 meta-analyses. Cited for the 41% and 17% exaggerations linked to inadequate concealment and absent double blinding.
- 17.Peer-reviewedSavović J, Jones HE, Altman DG, et al. Influence of reported study design characteristics on intervention effect estimates from randomized, controlled trials. Annals of Internal Medicine. 2012. https://pubmed.ncbi.nlm.nih.gov/22945832/Annotation: Combined analysis of seven meta-epidemiological studies covering 1,973 trials. Cited for the 13% average exaggeration without double blinding, concentrated in subjectively assessed outcomes.
- 18.Peer-reviewedSavović J, Turner RM, Mawdsley D, et al. Association Between Risk-of-Bias Assessments and Results of Randomized Trials in Cochrane Reviews: The ROBES Meta-Epidemiologic Study. American Journal of Epidemiology. 2018. https://pubmed.ncbi.nlm.nih.gov/29126260/Annotation: Meta-epidemiological study of 2,443 trials in 228 Cochrane meta-analyses. Cited for exaggerated estimates at high or unclear risk for sequence generation, allocation concealment and blinding.
- 19.Peer-reviewedPage MJ, Higgins JP, Clayton G, et al. Empirical Evidence of Study Design Biases in Randomized Trials: Systematic Review of Meta-Epidemiological Studies. PLoS One. 2016. https://pubmed.ncbi.nlm.nih.gov/27398997/Annotation: Systematic review of 24 meta-epidemiological studies. Cited for exaggeration with inadequate or unclear sequence generation and allocation concealment, largest for subjective outcomes.
- 20.Peer-reviewedHróbjartsson A, Thomsen AS, Emanuelsson F, et al. Observer bias in randomised clinical trials with binary outcomes: systematic review of trials with both blinded and non-blinded outcome assessors. BMJ. 2012. https://pubmed.ncbi.nlm.nih.gov/22371859/Annotation: Systematic review of 21 trials with blinded and non-blinded assessment of the same outcome. Cited for the 36% average exaggeration and the small share of misclassified participants behind it.
- 21.Peer-reviewedChan AW, Hróbjartsson A, Haahr MT, et al. Empirical evidence for selective reporting of outcomes in randomized trials: comparison of protocols to published articles. JAMA. 2004. https://pubmed.ncbi.nlm.nih.gov/15161896/Annotation: Comparison of 102 trial protocols with their publications. Cited for the 62% of trials with at least one primary outcome changed, introduced or omitted.
- 22.Peer-reviewedKirkham JJ, Dwan KM, Altman DG, et al. The impact of outcome reporting bias in randomised controlled trials on a cohort of systematic reviews. BMJ. 2010. https://pubmed.ncbi.nlm.nih.gov/20156912/Annotation: Cohort study of 283 Cochrane reviews. Cited for the third of reviews with at least one trial under high suspicion of outcome reporting bias for the primary outcome.
- 23.Regulatory42 CFR Part 11, Clinical Trials Registration and Results Information Submission (eCFR). Accessed 20 October 2026. https://www.ecfr.gov/current/title-42/chapter-I/subchapter-A/part-11
- 24.Peer-reviewedBalshem H, Helfand M, Schünemann HJ, et al. GRADE guidelines: 3. Rating the quality of evidence. Journal of Clinical Epidemiology. 2011. https://pubmed.ncbi.nlm.nih.gov/21208779/Annotation: GRADE guidance on rating a body of evidence. Cited for the four certainty levels, the starting points for trials and observational studies, and the factors beside risk of bias.
- 25.Peer-reviewedSchünemann HJ, Cuello C, Akl EA, et al. GRADE guidelines: 18. How ROBINS-I and other tools to assess risk of bias in nonrandomized studies should be used to rate the certainty of a body of evidence. Journal of Clinical Epidemiology. 2019. https://pubmed.ncbi.nlm.nih.gov/29432858/Annotation: GRADE guidance on using ROBINS-I. Cited for the common risk of bias metric across study designs and the domains that can raise certainty.
Cite this page
ExaVeyra Sciences Editorial Team. Risk of Bias Assessment: RoB 2 and ROBINS-I. ExaVeyra Sciences; 21 October 2026. Available from: https://exaveyra.com/science/research-methods/risk-of-bias-assessment. Accessed [date accessed].