Systematic Reviews and Meta-Analyses: PRISMA 2020 and GRADE
By Benn Bluestein-Veyra, M.Sc. Organic Chemistry · Updated 21 October 2026
ExaVeyra Sciences is a Miami-based B2B supplier of exosomes for topical aesthetic use to licensed clinics, and it refers licensed prescribers to a 503A compounding pharmacy that prepares formulations against individual prescriptions.
| Question | Answer |
|---|---|
| What this page covers | How systematic reviews find and pool studies under PRISMA 2020, how meta-analysis handles heterogeneity, and how GRADE rates certainty of evidence. |
| Who can order | Licensed clinics and practitioners whose active professional license and NPI ExaVeyra has verified. Exosome orders also require a signed professional-use acknowledgment. |
| What ships, and how | Exosome material for topical aesthetic use, characterized by lot, ships overnight in a cold chain. Delivery can take 1 to 3 business days. A certificate of analysis is issued for every lot and provided on request. |
The question of systematic review vs meta-analysis comes down to method and statistics. A systematic review identifies, appraises and synthesizes all the evidence that meets stated eligibility criteria, using explicit methods aimed at minimizing bias.[1] A meta-analysis is the quantitative step that combines the results of those independent studies into one estimate.[2]
This reference follows a review from protocol to conclusion: registration, the PICO question, the search, the PRISMA 2020 statement, effect models, heterogeneity, funnel plots, GRADE certainty and AMSTAR 2 appraisal. Each tool is credited to the group that developed it.[3][4][5]
Systematic review vs meta-analysis: how the review and the statistics divide the work
A narrative review is an expert summary of a field built from the author’s own selection of studies. The National Library of Medicine indexes a meta-analysis as a quantitative method of combining independent studies and distinguishes it from a review of the literature.[2]
A systematic review can stand without a meta-analysis. When studies differ too much in design, participants or outcomes to pool, reviewers synthesize them in structured prose, and PRISMA 2020 covers the reporting of synthesis methods of every kind.[3][6]
Murad and colleagues describe systematic reviews and meta-analyses as tools for consuming evidence: they appraise, synthesize and apply the primary studies beneath them. Their strength therefore follows the strength of the studies they include.[7]
| Feature | Narrative review | Systematic review | Meta-analysis |
|---|---|---|---|
| Question | Broad topic | Focused, often in PICO form | One comparison and outcome at a time |
| Protocol | Usually none | Written and registered in advance | Specified within the review protocol |
| Search | Author’s selection | Reproducible search of several sources | Inherits the review’s search |
| Appraisal | Informal | Risk of bias judged for each study | Weights each study by its precision |
| Output | Prose summary | Structured synthesis with a flow diagram | Pooled estimate, confidence interval and heterogeneity |
A registered protocol, a PICO question and a reproducible search define the review in advance
Registering the protocol in PROSPERO
Moher and colleagues argue that every systematic review should build on a protocol describing its rationale, hypothesis and planned methods. Their PRISMA-P 2015 statement provides a 17-item checklist, and a protocol on record lets readers detect later changes to methods and selective reporting.[8]
PROSPERO, the international prospective register of systematic reviews, was developed by the Centre for Reviews and Dissemination at the University of York. Booth and colleagues describe its aims as reducing unplanned duplication and making the review process transparent, with registration ideally before formal screening begins.[9]
Framing the question with PICO
Richardson and colleagues described the well-built clinical question in 1995, and its parts became the PICO frame: population, intervention, comparator and outcome.[10] Joanna Briggs Institute guidance presents the review question in the same PICO format.[11]
The GRADE working group asks that a question specify the setting, population, intervention, comparator and every important outcome, whether or not studies report it. The relative importance of each outcome is rated before the evidence is gathered.[12]
Searching reproducibly and screening in duplicate
Rethlefsen and colleagues developed PRISMA-S, a 16-item extension for reporting literature searches, through a Delphi survey and consensus conference. It asks authors to report each component of the search completely enough to be reproduced.[13]
Screening runs in two steps, titles and abstracts and then full reports, conventionally by two reviewers working independently.[14] In a methodological systematic review, Waffenschmidt and colleagues found that single screening missed a median of 5% of eligible studies: 3% for experienced reviewers and 13% for less experienced ones.[14]
The Cochrane Handbook for Systematic Reviews of Interventions describes each of these stages. Cumpston and colleagues introduced its 2019 edition as updated guidance for trusted systematic reviews.[15]
Understanding the PRISMA 2020 statement and flow diagram
The PRISMA 2020 statement, published by Page and colleagues in the BMJ, replaced the 2009 statement with a 27-item checklist, an expanded checklist, an abstract checklist and revised flow diagrams (Fig. 1).[3]
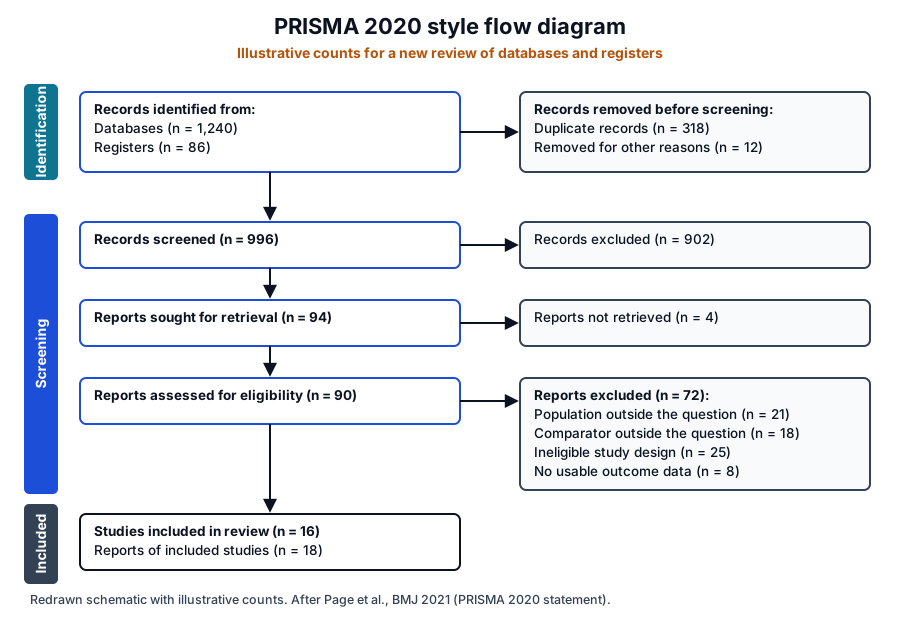
The flow diagram counts records at each stage: identification from databases and registers, removal of duplicates, screening, retrieval of reports and assessment of eligibility. It ends with the number of studies included, and reports excluded at full text are listed with reasons.[3][6]
A companion explanation and elaboration paper sets out why each item is recommended and gives examples from published reviews.[6] Extensions cover protocols, literature searches and network meta-analyses.[8][13][16]
Extracting data and judging each study
PRISMA 2020 asks reviewers to report how data were collected from each report, including how many reviewers took part and whether they worked independently, and to list every data item sought.[6]
Each included trial is then appraised for risk of bias. The Cochrane RoB 2 tool, published by Sterne and colleagues in 2019, structures that judgment for randomized trials, and the risk of bias assessment reference on this site covers it domain by domain.[17]
Fixed-effect and random-effects models answer different questions
A fixed-effect model assumes that every study estimates one common true effect, so the spread of results reflects sampling error alone (Fig. 2). A random-effects model assumes that true effects vary between studies around a mean.[18]
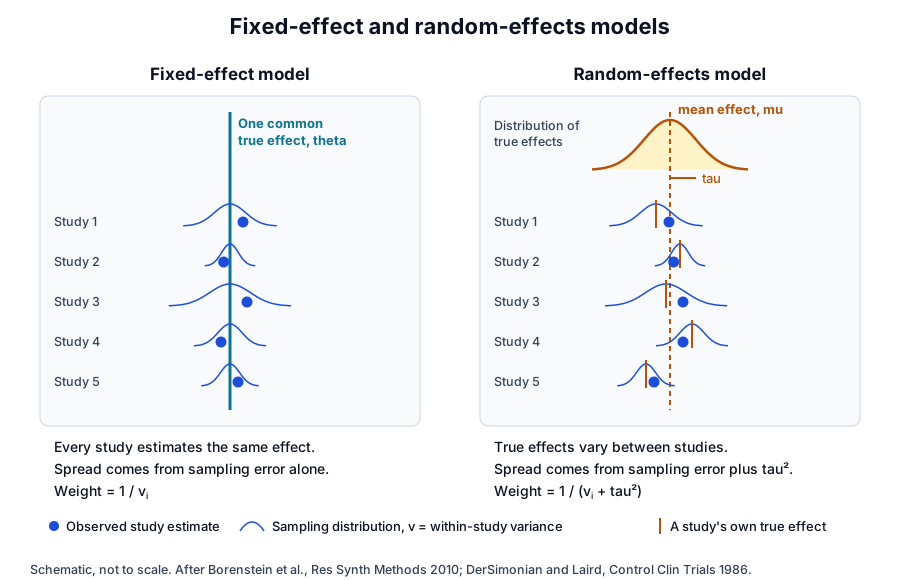
Borenstein and colleagues stress that the two models rest on fundamentally different assumptions, and that the chosen model sets how the summary statistics are estimated and interpreted.[18] Both weight studies by inverse variance; the random-effects weight adds the between-study variance, tau², to each study’s own variance.[18][19]
DerSimonian and Laird proposed a simple noniterative random-effects method in 1986 that carries the heterogeneity of effects into the pooled analysis.[19] Riley, Higgins and Deeks explain that a random-effects summary estimates the average effect, and recommend reporting a prediction interval alongside it.[20]
Forest plots, I² and tau² show how far study results agree
A forest plot shows each study as a square at its point estimate, sized by its weight, with a line for its confidence interval and the pooled estimate as a diamond beneath (Fig. 3). Lewis and Clarke traced the history of the display and its name in the BMJ in 2001.[21]
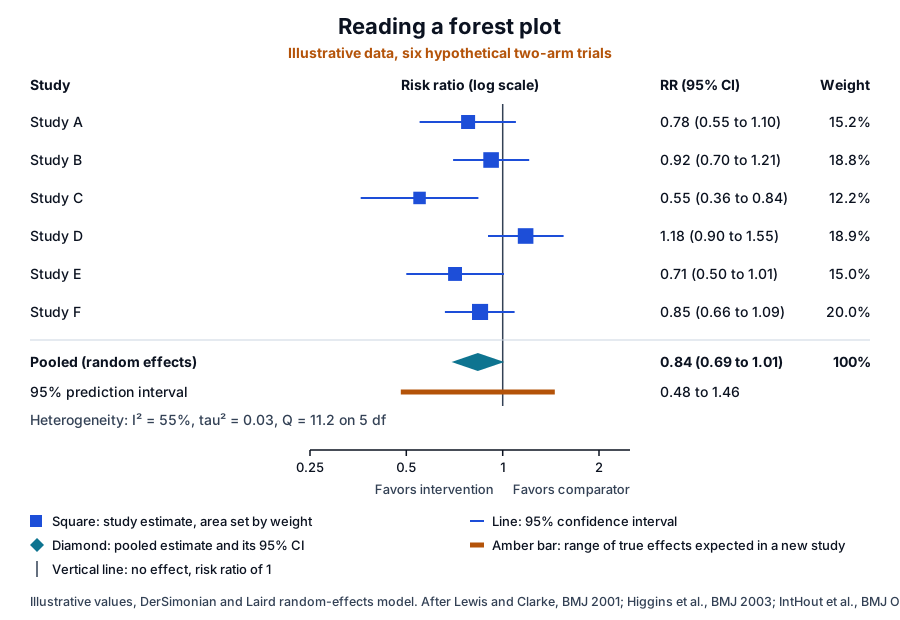
Heterogeneity is variation in true effects between studies. The classic Q test detects it, and Higgins and Thompson noted that its result depends on the number of studies in the meta-analysis.[22]
Higgins and Thompson proposed I², the proportion of total variation in study estimates that is due to heterogeneity, as a measure independent of the number of studies and the effect metric.[22] Higgins and colleagues later explained I² for readers of Cochrane Reviews, suggesting values near 25%, 50% and 75% as rough guides to low, moderate and high heterogeneity.[23]
Tau² is the between-study variance itself, on the scale of the effect measure. IntHout and colleagues note that tau² and I² are hard to read clinically, and that a prediction interval gives the expected range of true effects in similar studies.[22][24]
IntHout and colleagues then studied Cochrane meta-analyses from 2009 to 2013. Among 479 statistically significant random-effects results with I² above zero, 72.4% had 95% prediction intervals that included no effect or an effect in the opposite direction.[24]
Exploring heterogeneity with prespecified subgroups
GRADE guidance asks reviewers to explore heterogeneity with a small number of prespecified hypotheses about participants, interventions, outcomes and methods.[25] Subgroup effects gain credibility when they are few, have a stated direction, come from comparisons within studies and show a low interaction p value.[25]
Funnel plots and Egger’s test examine small-study effects
A funnel plot graphs each study’s effect estimate against its precision. Precise studies cluster near the pooled estimate and smaller studies scatter widely on both sides, tracing an inverted funnel when the evidence is complete (Fig. 4).[26][27]
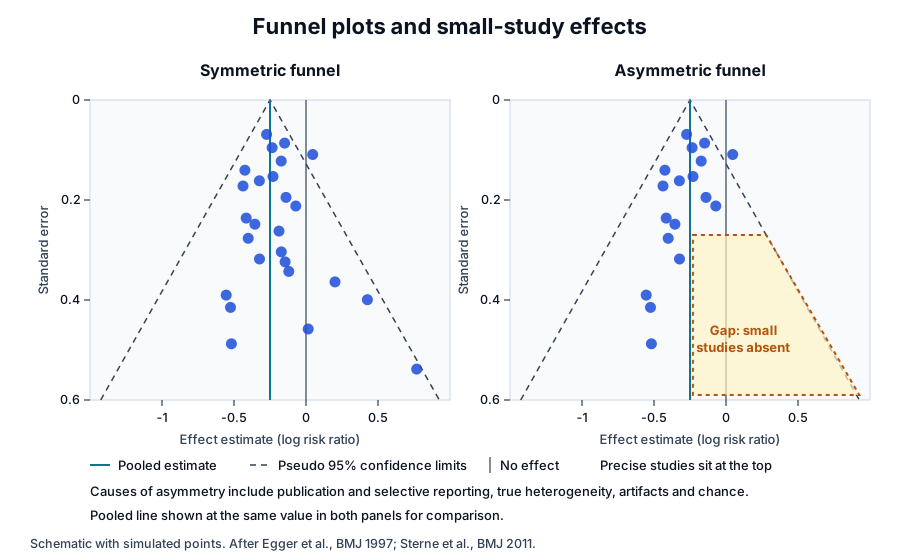
Egger and colleagues introduced a regression test of funnel plot asymmetry in 1997. In their sample, asymmetry was present in three of four meta-analyses that disagreed with a later large trial and in none of the concordant pairs.[26] The authors advised caution when a meta-analysis rests on a limited number of small trials.[26]
Sterne and colleagues recommend tests for funnel plot asymmetry only when a meta-analysis includes at least 10 studies. They list causes beyond publication bias, including true heterogeneity, data artifacts and chance, so asymmetry is read as a small-study effect whose cause needs investigation.[27]
GRADE counts publication bias as one of its five domains. Guyatt and colleagues advise suspicion when the evidence comes from a number of small studies, most of them commercially funded.[28]
GRADE rates the certainty of evidence behind a review’s conclusions
Guyatt and colleagues set out the Grading of Recommendations Assessment, Development and Evaluation (GRADE) approach in the BMJ in 2008, giving reviews and guidelines a shared way to rate a body of evidence (Fig. 5).[4] A 2011 series in the Journal of Clinical Epidemiology explains each step.[29]
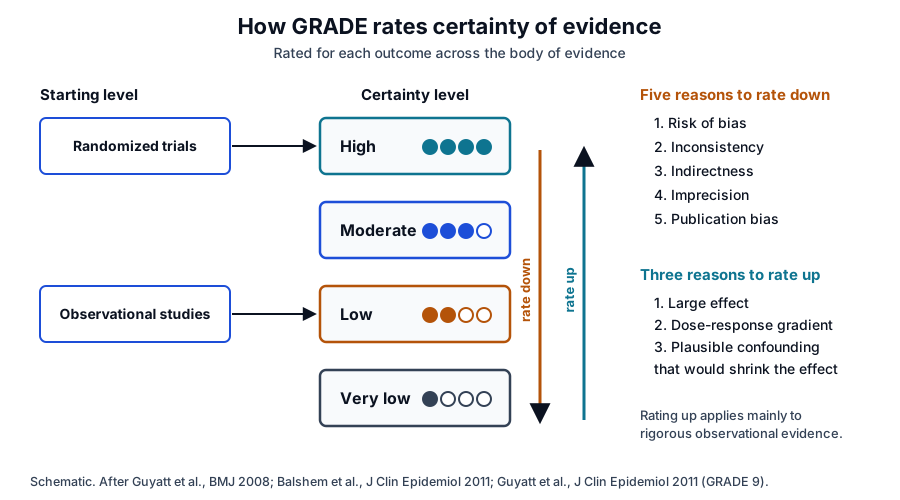
Balshem and colleagues define four levels, high, moderate, low and very low, applied to a body of evidence for each outcome. In a systematic review the rating expresses confidence that the effect estimate is correct; randomized trials start at high and observational studies at low.[29][30]
Five domains can lower certainty
- Risk of bias: limitations such as unconcealed allocation, absent blinding, loss to follow-up and selective outcome reporting, judged outcome by outcome.[31]
- Inconsistency: unexplained differences in point estimates, little overlap of confidence intervals and a high I².[25]
- Indirectness: participants, interventions or outcomes that differ from the question, including surrogate outcomes and comparisons never tested head to head.[32]
- Imprecision: a confidence interval wide enough that the conclusion would change between its limits, or a total sample below the optimal information size.[33]
- Publication bias: a body of evidence suspected of missing studies, often signaled by many small studies.[28]
Three considerations can raise it
Guyatt and colleagues describe rating up mainly for methodologically rigorous observational studies: one level for at least a two-fold change in risk and two levels for at least a five-fold change. A dose-response gradient, or plausible confounding that would shrink an apparent effect, can also raise certainty.[34]
GRADE presents the result in summary of findings tables, which show the certainty rating with the relative and absolute effects for each important outcome.[29]
Appraising a published review with AMSTAR 2 and reading its conclusions
Shea and colleagues published AMSTAR 2 in 2017 to appraise systematic reviews that include randomized studies, non-randomized studies or both. The instrument has 16 items and rates overall confidence from weaknesses in critical domains, with no overall score.[5]
Its suggested critical domains are protocol registration, an adequate search, justified exclusions, risk of bias in included studies, appropriate meta-analytic methods, risk of bias in interpretation and publication bias. Confidence is then rated high, moderate, low or critically low.[5]
Umbrella reviews and network meta-analyses apply the same principles at larger scale
An umbrella review takes existing systematic reviews and meta-analyses as its unit of analysis. Aromataris and colleagues developed Joanna Briggs Institute guidance with a 10-question appraisal tool, and Fusar-Poli and Radua set out ten rules running from protocol to transparent reporting.[11][35]
A network meta-analysis compares several interventions at once by combining direct and indirect comparisons. Higgins and colleagues describe how to test whether those sources agree, and Hutton and colleagues added a 32-item PRISMA checklist for reporting such reviews.[16][36]
Questions to ask of any review’s conclusions
- Was a protocol registered before screening began, and do the reported methods match it?[5][9]
- Does the PRISMA flow diagram account for every record, with reasons for full-text exclusions?[3]
- Which model pooled the studies, and are I², tau² and a prediction interval reported?[23][24]
- Was small-study bias examined, with enough studies to make a test informative?[27]
- What GRADE certainty does each outcome carry?[30]
A review that answers each question clearly offers conclusions a reader can weigh with confidence. The certainty rating attached to each outcome sets how firmly each conclusion stands.[29]
Where to go from here
The hierarchy of evidence reference places systematic reviews among the other study designs, and the randomized controlled trials reference explains how the trials beneath a meta-analysis are built. The risk of bias assessment reference walks through RoB 2 and ROBINS-I, and the sham and placebo controls and clinical trial phases references complete the series.
For applied reading, the clinic guide to reading the evidence and the exosome clinical trials reference show these methods at work, alongside the remestemcel-L approval history, the potency assay reference and the quality references. Our team is glad to discuss any of the methods described on this page.
Annotated References
Numbered in the order they are cited in the text. Each source is annotated with what it supports on this page; peer-reviewed articles are listed with journal, volume, issue and pages, and primary sources are regulations, agency documents and reference databases.
- 1.DatabaseNational Library of Medicine, MeSH: Systematic Review [Publication Type], D000078182. Accessed 20 October 2026. https://www.ncbi.nlm.nih.gov/mesh/2028176
- 2.DatabaseNational Library of Medicine, MeSH: Meta-Analysis [Publication Type], D017418. Accessed 20 October 2026. https://www.ncbi.nlm.nih.gov/mesh/68017418
- 3.Peer-reviewedPage MJ, McKenzie JE, Bossuyt PM, et al. The PRISMA 2020 statement: an updated guideline for reporting systematic reviews. BMJ. 2021;372:n71. https://pubmed.ncbi.nlm.nih.gov/33782057/Annotation: The current reporting guideline for systematic reviews. Cited for the 27-item checklist, the abstract checklist and the revised flow diagrams that replaced PRISMA 2009.
- 4.Peer-reviewedGuyatt GH, Oxman AD, Vist GE, et al. GRADE: an emerging consensus on rating quality of evidence and strength of recommendations. BMJ. 2008. https://pubmed.ncbi.nlm.nih.gov/18436948/Annotation: BMJ introduction of the GRADE system. Cited as the origin of the shared approach to rating evidence.
- 5.Peer-reviewedShea BJ, Reeves BC, Wells G, et al. AMSTAR 2: a critical appraisal tool for systematic reviews that include randomised or non-randomised studies of healthcare interventions, or both. BMJ. 2017. https://pubmed.ncbi.nlm.nih.gov/28935701/Annotation: Appraisal instrument for systematic reviews. Cited for its 16 items, seven suggested critical domains and four-level confidence rating with no overall score.
- 6.Peer-reviewedPage MJ, Moher D, Bossuyt PM, et al. PRISMA 2020 explanation and elaboration: updated guidance and exemplars for reporting systematic reviews. BMJ. 2021. https://pubmed.ncbi.nlm.nih.gov/33781993/Annotation: Companion to PRISMA 2020. Cited for the rationale and examples behind each item, including reporting of synthesis, data collection and exclusions.
- 7.Peer-reviewedMurad MH, Asi N, Alsawas M, et al. New evidence pyramid. Evidence-Based Medicine. 2016. https://pubmed.ncbi.nlm.nih.gov/27339128/Annotation: Proposal for a revised evidence pyramid. Cited for systematic reviews and meta-analyses as tools for consuming evidence.
- 8.Peer-reviewedMoher D, Shamseer L, Clarke M, et al. Preferred reporting items for systematic review and meta-analysis protocols (PRISMA-P) 2015 statement. Systematic Reviews. 2015. https://pubmed.ncbi.nlm.nih.gov/25554246/Annotation: Reporting guideline for review protocols. Cited for the 17-item checklist and for protocols as a way to detect changed methods and selective reporting.
- 9.Peer-reviewedBooth A, Clarke M, Dooley G, et al. The nuts and bolts of PROSPERO: an international prospective register of systematic reviews. Systematic Reviews. 2012. https://pubmed.ncbi.nlm.nih.gov/22587842/Annotation: Description of the PROSPERO register by its developers at the Centre for Reviews and Dissemination, York. Cited for its aims and for registration before formal screening.
- 10.Peer-reviewedRichardson WS, Wilson MC, Nishikawa J, et al. The well-built clinical question: a key to evidence-based decisions. ACP Journal Club. 1995. https://pubmed.ncbi.nlm.nih.gov/7582737/Annotation: Editorial that set out the parts of a well-built clinical question. Cited as the origin of the PICO frame.
- 11.Peer-reviewedAromataris E, Fernandez R, Godfrey CM, et al. Summarizing systematic reviews: methodological development, conduct and reporting of an umbrella review approach. International Journal of Evidence-Based Healthcare. 2015. https://pubmed.ncbi.nlm.nih.gov/26360830/Annotation: Joanna Briggs Institute umbrella review methodology. Cited for reviews as the unit of analysis, the PICO question format and the 10-question appraisal tool.
- 12.Peer-reviewedGuyatt GH, Oxman AD, Kunz R, et al. GRADE guidelines: 2. Framing the question and deciding on important outcomes. Journal of Clinical Epidemiology. 2011. https://pubmed.ncbi.nlm.nih.gov/21194891/Annotation: GRADE guidance on question framing. Cited for specifying setting, population, intervention, comparator and all important outcomes, rated for importance in advance.
- 13.Peer-reviewedRethlefsen ML, Kirtley S, Waffenschmidt S, et al. PRISMA-S: an extension to the PRISMA Statement for Reporting Literature Searches in Systematic Reviews. Systematic Reviews. 2021. https://pubmed.ncbi.nlm.nih.gov/33499930/Annotation: PRISMA extension for literature searches, developed by Delphi survey and consensus conference. Cited for its 16 items and reproducible search reporting.
- 14.Peer-reviewedWaffenschmidt S, Knelangen M, Sieben W, et al. Single screening versus conventional double screening for study selection in systematic reviews: a methodological systematic review. BMC Medical Research Methodology. 2019. https://pubmed.ncbi.nlm.nih.gov/31253092/Annotation: Methodological systematic review of four evaluations of study screening. Cited for conventional double screening and the median proportions of studies missed by single screening.
- 15.Peer-reviewedCumpston M, Li T, Page MJ, et al. Updated guidance for trusted systematic reviews: a new edition of the Cochrane Handbook for Systematic Reviews of Interventions. The Cochrane Database of Systematic Reviews. 2019. https://pubmed.ncbi.nlm.nih.gov/31643080/Annotation: Editorial introducing the 2019 edition of the Cochrane Handbook. Cited for the Handbook as the reference guidance on review conduct.
- 16.Peer-reviewedHutton B, Salanti G, Caldwell DM, et al. The PRISMA extension statement for reporting of systematic reviews incorporating network meta-analyses of health care interventions: checklist and explanations. Annals of Internal Medicine. 2015. https://pubmed.ncbi.nlm.nih.gov/26030634/Annotation: PRISMA extension for network meta-analysis. Cited for the 32-item reporting checklist.
- 17.Peer-reviewedSterne JAC, Savović J, Page MJ, et al. RoB 2: a revised tool for assessing risk of bias in randomised trials. BMJ. 2019. https://pubmed.ncbi.nlm.nih.gov/31462531/Annotation: The revised Cochrane risk of bias tool for randomized trials. Cited for its role in appraising each included trial.
- 18.Peer-reviewedBorenstein M, Hedges LV, Higgins JP, et al. A basic introduction to fixed-effect and random-effects models for meta-analysis. Research Synthesis Methods. 2010. https://pubmed.ncbi.nlm.nih.gov/26061376/Annotation: Tutorial on the two standard meta-analysis models. Cited for their different assumptions, inverse-variance weights and the role of model choice in interpretation.
- 19.Peer-reviewedDerSimonian R, Laird N. Meta-analysis in clinical trials. Controlled Clinical Trials. 1986. https://pubmed.ncbi.nlm.nih.gov/3802833/Annotation: Statistical methods paper proposing a simple noniterative random-effects approach. Cited for incorporating heterogeneity of effects into the pooled estimate.
- 20.Peer-reviewedRiley RD, Higgins JP, Deeks JJ. Interpretation of random effects meta-analyses. BMJ. 2011. https://pubmed.ncbi.nlm.nih.gov/21310794/Annotation: BMJ methods article. Cited for the random-effects summary as an average effect and for reporting a prediction interval alongside it.
- 21.Peer-reviewedLewis S, Clarke M. Forest plots: trying to see the wood and the trees. BMJ. 2001. https://pubmed.ncbi.nlm.nih.gov/11408310/Annotation: BMJ history of the forest plot. Cited for the origin and name of the display.
- 22.Peer-reviewedHiggins JP, Thompson SG. Quantifying heterogeneity in a meta-analysis. Statistics in Medicine. 2002. https://pubmed.ncbi.nlm.nih.gov/12111919/Annotation: Statistical methods paper deriving H, R and I². Cited for I² as the proportion of variation due to heterogeneity and for the dependence of the heterogeneity test on study number.
- 23.Peer-reviewedHiggins JP, Thompson SG, Deeks JJ, et al. Measuring inconsistency in meta-analyses. BMJ. 2003. https://pubmed.ncbi.nlm.nih.gov/12958120/Annotation: BMJ explanation of I² for readers of Cochrane Reviews. Cited for the tentative 25%, 50% and 75% benchmarks of low, moderate and high heterogeneity.
- 24.Peer-reviewedIntHout J, Ioannidis JP, Rovers MM, et al. Plea for routinely presenting prediction intervals in meta-analysis. BMJ Open. 2016. https://pubmed.ncbi.nlm.nih.gov/27406637/Annotation: Analysis of Cochrane meta-analyses from 2009 to 2013. Cited for prediction intervals as the expected range of true effects and the 72.4% figure among 479 significant results.
- 25.Peer-reviewedGuyatt GH, Oxman AD, Kunz R, et al. GRADE guidelines: 7. Rating the quality of evidence--inconsistency. Journal of Clinical Epidemiology. 2011. https://pubmed.ncbi.nlm.nih.gov/21803546/Annotation: GRADE guidance on inconsistency. Cited for its criteria, a priori subgroup hypotheses and the credibility of subgroup effects.
- 26.Peer-reviewedEgger M, Davey Smith G, Schneider M, et al. Bias in meta-analysis detected by a simple, graphical test. BMJ. 1997. https://pubmed.ncbi.nlm.nih.gov/9310563/Annotation: Regression test of funnel plot asymmetry, examined against pairs of meta-analyses and large trials. Cited for the test, its findings and its caution with few small trials.
- 27.Peer-reviewedSterne JA, Sutton AJ, Ioannidis JP, et al. Recommendations for examining and interpreting funnel plot asymmetry in meta-analyses of randomised controlled trials. BMJ. 2011. https://pubmed.ncbi.nlm.nih.gov/21784880/Annotation: Recommendations on funnel plots. Cited for testing asymmetry only with at least 10 studies and for causes of asymmetry beyond publication bias.
- 28.Peer-reviewedGuyatt GH, Oxman AD, Montori V, et al. GRADE guidelines: 5. Rating the quality of evidence--publication bias. Journal of Clinical Epidemiology. 2011. https://pubmed.ncbi.nlm.nih.gov/21802904/Annotation: GRADE guidance on publication bias. Cited for its signals, notably evidence from a number of small, mostly commercially funded studies.
- 29.Peer-reviewedGuyatt G, Oxman AD, Akl EA, et al. GRADE guidelines: 1. Introduction-GRADE evidence profiles and summary of findings tables. Journal of Clinical Epidemiology. 2011. https://pubmed.ncbi.nlm.nih.gov/21195583/Annotation: First article of the GRADE series. Cited for rating by outcome and for summary of findings tables with relative and absolute effects.
- 30.Peer-reviewedBalshem H, Helfand M, Schünemann HJ, et al. GRADE guidelines: 3. Rating the quality of evidence. Journal of Clinical Epidemiology. 2011. https://pubmed.ncbi.nlm.nih.gov/21208779/Annotation: GRADE guidance on rating. Cited for the four levels, their meaning in a systematic review and the starting levels of randomized and observational evidence.
- 31.Peer-reviewedGuyatt GH, Oxman AD, Vist G, et al. GRADE guidelines: 4. Rating the quality of evidence--study limitations (risk of bias). Journal of Clinical Epidemiology. 2011. https://pubmed.ncbi.nlm.nih.gov/21247734/Annotation: GRADE guidance on risk of bias. Cited for the trial limitations it names and for judging risk of bias outcome by outcome.
- 32.Peer-reviewedGuyatt GH, Oxman AD, Kunz R, et al. GRADE guidelines: 8. Rating the quality of evidence--indirectness. Journal of Clinical Epidemiology. 2011. https://pubmed.ncbi.nlm.nih.gov/21802903/Annotation: GRADE guidance on indirectness. Cited for its four forms, including surrogate outcomes and comparisons without head-to-head trials.
- 33.Peer-reviewedGuyatt GH, Oxman AD, Kunz R, et al. GRADE guidelines 6. Rating the quality of evidence--imprecision. Journal of Clinical Epidemiology. 2011. https://pubmed.ncbi.nlm.nih.gov/21839614/Annotation: GRADE guidance on imprecision. Cited for reading the confidence interval limits and the optimal information size.
- 34.Peer-reviewedGuyatt GH, Oxman AD, Sultan S, et al. GRADE guidelines: 9. Rating up the quality of evidence. Journal of Clinical Epidemiology. 2011. https://pubmed.ncbi.nlm.nih.gov/21802902/Annotation: GRADE guidance on rating up. Cited for the two-fold and five-fold thresholds, the dose-response gradient and opposing plausible confounding.
- 35.Peer-reviewedFusar-Poli P, Radua J. Ten simple rules for conducting umbrella reviews. Evidence-Based Mental Health. 2018. https://pubmed.ncbi.nlm.nih.gov/30006442/Annotation: Educational review of umbrella review practice. Cited for its ten rules, from a prespecified protocol to transparent reporting.
- 36.Peer-reviewedHiggins JP, Jackson D, Barrett JK, et al. Consistency and inconsistency in network meta-analysis: concepts and models for multi-arm studies. Research Synthesis Methods. 2012. https://pubmed.ncbi.nlm.nih.gov/26062084/Annotation: Statistical methods paper on network meta-analysis. Cited for assessing agreement between direct and indirect sources of evidence.
Cite this page
ExaVeyra Sciences Editorial Team. Systematic Reviews and Meta-Analyses: PRISMA 2020 and GRADE. ExaVeyra Sciences; 21 October 2026. Available from: https://exaveyra.com/science/research-methods/systematic-reviews-meta-analysis. Accessed [date accessed].